BPA Memo on Baseline Methodology
advertisement
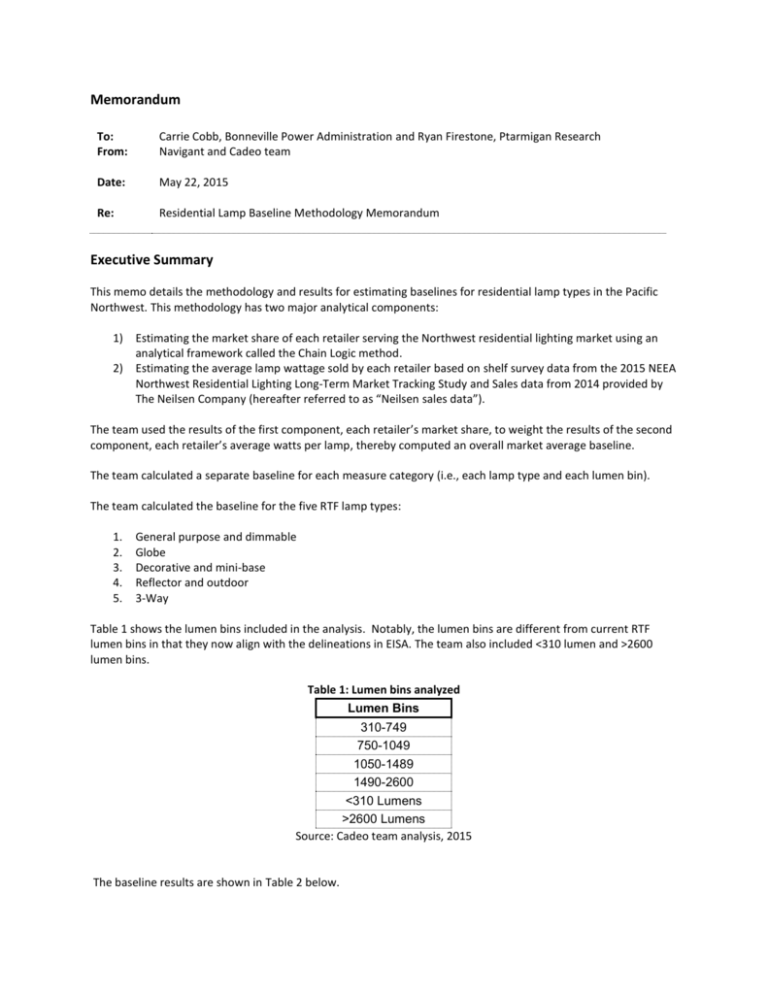
Memorandum To: From: Carrie Cobb, Bonneville Power Administration and Ryan Firestone, Ptarmigan Research Navigant and Cadeo team Date: May 22, 2015 Re: Residential Lamp Baseline Methodology Memorandum Executive Summary This memo details the methodology and results for estimating baselines for residential lamp types in the Pacific Northwest. This methodology has two major analytical components: 1) Estimating the market share of each retailer serving the Northwest residential lighting market using an analytical framework called the Chain Logic method. 2) Estimating the average lamp wattage sold by each retailer based on shelf survey data from the 2015 NEEA Northwest Residential Lighting Long-Term Market Tracking Study and Sales data from 2014 provided by The Neilsen Company (hereafter referred to as “Neilsen sales data”). The team used the results of the first component, each retailer’s market share, to weight the results of the second component, each retailer’s average watts per lamp, thereby computed an overall market average baseline. The team calculated a separate baseline for each measure category (i.e., each lamp type and each lumen bin). The team calculated the baseline for the five RTF lamp types: 1. 2. 3. 4. 5. General purpose and dimmable Globe Decorative and mini-base Reflector and outdoor 3-Way Table 1 shows the lumen bins included in the analysis. Notably, the lumen bins are different from current RTF lumen bins in that they now align with the delineations in EISA. The team also included <310 lumen and >2600 lumen bins. Table 1: Lumen bins analyzed Lumen Bins 310-749 750-1049 1050-1489 1490-2600 <310 Lumens >2600 Lumens Source: Cadeo team analysis, 2015 The baseline results are shown in Table 2 below. Table 2: Average Lamp Wattage by Lamp Type and Lumen Bin Lumen Bins Lamp Type General Purpose and Dimmable Globe Reflectors and Outdoor Decorative and Mini-Base 3-Way <310 Lumens 310-749 750-1049 1050-1489 1490-2600 >2600 Lumens 25 31 30 37 28 20 46 68 42 67 103 NA 39 42 30 46 92 115 24 49 18 100 23 30 43 NA 100 118 112 269 Source: Cadeo team analysis of Northwest Energy Efficiency Alliance, “2013-2014 Northwest Residential Lighting Long-Term Market Tracking Study” January 22, 2015 and Neilsen Sales Data, 2014. Methodology The following methodology discussion is divided into the two main components of the baseline calculation. 1. Determine the market share for each lamp retailer or group of retailers in Pacific Northwest. 2. Determine a technology-weighted average wattage per retailer, lamp type and lumen bin for both shelf data and Neilsen sales data. 1. Determine the market share for each lamp retailer or group of retailers in Pacific Northwest. a) Segment by store categories. Using information gathered during the 2014 Energy Star Partners Meeting, the team segmented the market by store categories: DIY (51%), Mass Merchandise (17%), Club Stores (17%), and Drug, Grocery and Small Hardware (15%). Table 3: Market share by store category Store Category Share DIY Mass Merchandise 51% 17% Club Stores 17% Drug, Grocery and Small Hardware 15% Source: Cadeo team analysis, 2015 Key Assumptions: ‘DIY’, ‘Mass Merchandise’, ‘Drug, Grocery and Small Hardware’ and ‘Club Stores’ categories cover all stores in which residential lamps are sold. Table 4: Stores by store category Store Category Retailer Home Center Mass Merchandise Club Stores A B C D E F G H I Other Drug, Grocery and Small Hardware Source: Cadeo team analysis, 2015 b) Assign market shares to each retailer within each store category. The team used retailer store counts in the Northwest and the average lamps stocked on each retailer’s shelves as a proxy for each retailer’s relative market share within each store category. The team calculated the total number of lamps each retailer makes ‘available’ for purchase by multiplying each retailer’s number of stores in the region by the average number of lamps stocked. The team then used this as a proxy for market share of units sold within each store category. Table 5: Store share within categories Store Category Retailer A B C D E F G H I Other Home Center Mass Merchandise Club Stores Drug, Grocery and Small Hardware Source: Cadeo team analysis, 2015 Retailer share within Category 58% 32% 10% 57% 18% 10% 15% 84% 16% 100% Key Assumptions: Retailer store counts and relative number of lamps stocked reflect retailers’ respective market shares. c) Summary Table 6: Summary market share table Store Category Category Share Home Center 51% Mass Merchandise 17% Club Stores 15% Drug, Grocery and Small Hardware Retailer A B C D E F G H I Other 17% Source: Cadeo team analysis, 2015 Retailer Share within Category 58% 32% 10% 57% 18% 10% 15% 84% 16% 100% 2. Determine technology-weighted average wattage, by retailer, lamp type and lumen bin for both the shelf data and Neilsen data. Having determined the market share for each retailer or group of retailers, the team then found the technology distribution for each retailer across lumen bins, using the 2015 NEEA Northwest Residential Lighting Long-Term Market Tracking Study and the Neilsen sales data. The following steps were used for both datasets to compute the baseline estimate: a. Clean NEEA shelf data and Neilsen sales data. The shelf and sales data include many more lamp types and styles than would be practical to break out individually for baseline analysis. The team screened each lamp type to determine, first, if it was appropriate to include in the analysis and, second, which measure category it should be mapped to. For example, the “general purpose and dimmable” lamp type comprised A-lamps, spiral/twister shape lamps, tube lamps and Circline lamps. To the extent possible, the team matched the binning choices made by the RTF in the current measure workbook. The lamp styles mapped to each lamp type are shown in Table 7: Lamp styles included in each . Table 7: Lamp styles included in each lamp type Lamp Styles Included Spiral/Twister A-lamp General Purpose and Dimmable Tube Circline Globe Globe Reflector and Outdoor Spotlight/Reflector/Flood Candelabra/Intermediate base, Candelabra with Medium Screw Decorative and Mini-base Adaptor 3-Way 3-Way Source: Cadeo team analysis, 2015 of Northwest Energy Efficiency Alliance, “2013-2014 Northwest Residential Lighting Long-Term Market Tracking Study” January 22, 2015 Lamp type Table 8: Lamps excluded illustrates lamp styles that were excluded from the analysis because they are not typically associated with the five lamp types. Table 8: Lamps excluded from shelf data Lamps Excluded Excluded from Rationale Linear fluorescent Technology Separate analysis HID Technology Specific application not part of measure scope Pin-base Base type Specific application not part of measure scope GU-base Base type Specific application not part of measure scope Large screw-base Base type Specific application not part of measure scope Bug light Lamp style Specific application not part of measure scope Night Light Lamp style Specific application not part of measure scope Other/Unknown Other Not enough data to categorize Source: Cadeo team analysis of Northwest Energy Efficiency Alliance, “2013-2014 Northwest Residential Lighting Long-Term Market Tracking Study” January 22, 2015 Although the bulb style and lamp codes in the Neilsen sales data were different from those in the sales data, the team excluded the same lamp styles and grouped lamps in a similar fashion to ensure consistency in the analysis. For example, the general purpose lamp type comprised A-lamps and tube lamps (Neilsen sales data did not include Circline lamps). The lamp styles associated with each lamp type are shown in Table 9. Table 9: Lamp styles included in each lamp type Lamp type General Purpose and Dimmable Lamp Styles Included Tube A-lamp Globe Globe Reflector and Outdoor Spotlight/Reflector/Flood Decorative and Mini-base Candle base 3-Way 3-Way Source: Cadeo team analysis of Neilsen sales data, 2014 Table 10 illustrates lamp styles that were excluded from the analysis because they are not typically associated with the five lamp types. Table 10: Lamps excluded from Neilsen sales data Lamp style removed Rationale Linear fluorescents Separate analysis Night lights Specific application not part of measure scope Holiday lights High-intensity lamps Specific application not part of measure scope Upon manual inspection appear to be appliance lamps either 12W or 40W. Heat lamps Specific application not part of measure scope Glitter and lava lamps Aquarium/reptile lamps Specific application not part of measure scope Appliance lamps BRS Bedrooms entryways HW Decorative indoor Menorahs Decorative Indoor Outdoor lamps Specific application not part of measure scope Upon manual inspection appear to be holiday lights Decorative Outdoor Upon manual inspection appear to be holiday lights DI Outdoor Upon manual inspection appear to be holiday lights DH Indoor Outdoor Upon manual inspection appear to be holiday lights Specific application not part of measure scope No data, few sales and no additional information Specific application not part of measure scope Flicker Specific application not part of measure scope Metal Halide Specific application not part of measure scope Mercury vapor Specific application not part of measure scope HDNL Upon manual inspection appears to be pin-based lamp Indoor parties Upon manual inspection appears to be black light I-O WET Location Lamps Specific application not part of measure scope Vehicle lights, except GE branded ones because those were unmarked and appear to be basic A19 LED. NB and NB BCRHSA No additional data available Outdoor Landscape lamps Outdoor landscape Specific application not part of measure scope Plant Specific application not part of measure scope Plug-in warmers Specific application not part of measure scope Source: Cadeo team analysis of Neilsen sales data, 2014 b. Compute technology mix for each lumen bin, retailer and lamp type. We computed the technology mix found in the NEEA shelf data and Neilsen sales data for each lamp type, lumen bin, and retailer or group of retailers. For example, Table 11 below shows the technology mix for general purpose lamps, according to the Neilsen sales data. Table 11: Technology mix for general purpose lamps (Sales data) Lumen Bins <310 310749 750-1049 1050-1489 14902600 >2600 CFL 4% 15% 37% 41% 63% 16% HAL 1% 32% 31% 57% 32% 1% INC 73% 51% 31% 2% 5% 83% Technology LED Total 21% 1% 1% 0% 0% 100% 100% 100% 100% 100% Source: Cadeo team analysis of Neilsen sales data. 0% 100% Key Assumptions: The mix of technologies stocked by retailers is proportional to the technology mix purchased and installed. c. Compute average watts for each lumen bin, retailer and lamp type. The team computed average watts for lamp each lumen bin, retailer and lamp type, for both datasets. The team used sales data where it was available and used the NEEA shelf data for the remaining retailers. For example, the table below displays the average watts for general purpose lamps, for the Neilsen sales data. Table 12: Average watts for general purpose lamps Lumen Bins <310 310-749 750-1049 10501489 14902600 >2600 CFL 16 14 15 24 26 45 HAL 21 38 51 70 103 400 INC 24 49 71 95 134 174 LED 4 8 10 16 Source: Cadeo team analysis of Neilsen sales data. 16 NA Technology Key Assumptions: The average lamp wattage shown in the datasets by lamp type and lumen bin represents the average wattage of lamps purchased and installed. d. Compute technology-weighted average watts per lumen bin for each lamp type and retailer. The team computed the technology-weighted average watts per lumen bin for both datasets by calculating the weighted average of the average wattages for each technology and the technology mix found for each retailer. Summary of Findings The baseline results are shown in Table 13 below. Table 13: Average Lamp Wattage by Lamp Type and Lumen Bin Lumen Bins Lamp Type General Purpose and Dimmable Globe Reflectors and Outdoor Decorative and MiniBase 3-Way <310 Lumens 310-749 750-1049 10501489 14902600 >2600 Lumens 25 31 30 37 28 20 46 68 42 67 103 NA 39 42 30 46 92 115 24 49 18 100 23 30 43 NA 100 118 112 269 Source: Cadeo team analysis of Northwest Energy Efficiency Alliance, “2013-2014 Northwest Residential Lighting Long-Term Market Tracking Study” January 22, 2015 and Neilsen Sales Data, 2014. The highlighted results in Table 13 were counterintuitive because the average wattage did not fit with the expected trend of decreasing wattage with decreasing lumen output. The team investigated these anomalies and provides explanation in the following bullets. Typically, an abrupt change in the technology mix from one lumen bin to the next is the cause of the counterintuitive result. For reference, the team includes the full technology mix for each lamp type and lumen bin in Table 14 and 15. General Purpose, 750-1049 lumens: Counterintuitively, the average watts for this lumen bin are lower than the lower lumen bin. However, the technology mix in both datasets reveals that this lumen bin has a significantly lower incandescent share than the lower lumen bin. General Purpose, 1490-2600 lumens: The average watts in this lumen bin are lower than the lower lumen bin. The technology mix in the shelf data reveals that the CFL share in this lumen bin is significantly higher than in the lower bin. Globe, 750-1049 lumens: This lumen bin is 0% incandescent for all retailers in the shelf data, compared to 97% in the lower lumen bin which explains the unusually low average wattage. Globe, >2600 lumens: No lamps stocked or sold in this lumen bin. Reflector and Outdoor, 750-1049 lumens: This lumen bin is significantly lower than the lower lumen bin. However, the LED share is 57% in the shelf data, compared to 15% in the lower lumen bin. The sales data shows a 54% CFL share for this lumen bin, compared to 4% in the lower lumen bin. Decorative and Mini-Base, 750-1049 lumens: The average wattage in this lumen bin appears extremely low, but can be explained by the fact that the majority of the lamps in both datasets are CFLs, whereas the next highest lumen bin is 100% incandescent. Decorative and Mini-Base, 1490-2600 lumens: This lumen bin is 100% CFL, explaining the significantly lower average wattage than the lower lumen bin, which is 100% incandescent. 3-Way, 310-749 lumens: No lamps sold or stocked for this lumen bin. Although the team emphasized consistency and quality control, the following three core weaknesses in the methodology remain. 1. Shelf data is not sales data. The team computed the average wattage using Neilsen sales data for those retailers that were covered in the dataset and used shelf data for the remaining retailers. Shelf data is only a proxy for product flow and may not accurately reflect the current practice baseline. 2. Timing of data collection. Neilsen sales data is covers all of 2014, whereas the shelf data reflects only what was stocked in December of 2014. The Neilsen data is therefore likely to include the sell through of lamps manufactured before the 1/1/2014 EISA deadline, inflating the share of incandescent lamps in the technology mix. 3. Difficulties with data cleaning. Differences in the lamp codes between the two datasets led to difficulties with data cleaning and the binning process. For example, the Neilsen sales data used “Tube” as a base type code for CFL spiral A-lamps, while the same code was used in the shelf data for actual tube-style lamps. The data cleaning process involved a number of judgement calls where additional information on lamps was not available. For these reasons, there may be meaningful differences between the datasets, both in terms of the lamp styles removed and included in the analysis and the binning process. Appendix I Table 14 Appendix I: Technology distribution of lamps stocked by lumen bins and shows the technology distribution of lamps by lumen bins and lamp types for the shelf data. The technology mix often reveals what is driving the final average wattages. As the share of incandescent lamps increases, the average wattage increases. Predictably, the incandescent share is the highest for the unregulated lumen bins. For example, general purpose lamps have the highest incandescent share at <310 lumens, >2600 lumens and across lumen bins in the 3-way lamp type. Table 14 Appendix I: Technology distribution of lamps stocked by lumen bins and lamp type in shelf data General Purpose Technol ogy <310 LUMENS 310-749 7501049 10501489 14902600 >2600 LUMEN S CFL 5% 15% 48% 38% 61% 18% HAL 5% 41% 30% 51% 32% 0% INC 83% 31% 7% 6% 3% 73% LED 8% 100% 13% 100% 14% 100% 5% 100% 5% 100% 9% 100% Total Globe Technol ogy <310 LUMENS 310-749 7501049 10501489 14902600 >2600 LUMEN S CFL 0.00% 8.93% 17.98% 0.00% 0.00% NA HAL 0.00% 1.86% 73.65% 3.94% 0.00% NA INC 90.66% 55.23% 8.36% 96.06% 100.00% NA LED Grand Total 9.34% 33.99% 0.00% 0.00% 0.00% NA 100% 100% 100% 100% 100% 100% Reflector and Outdoor Technol ogy <310 LUMENS 310-749 7501049 10501489 14902600 >2600 LUMEN S CFL 1% 12% 22% 26% 0% 0% HAL 15% 19% 10% 42% 86% 6% INC 80% 55% 11% 3% 13% 93% LED Grand Total 5% 15% 57% 29% 1% 1% 100% 100% 100% 100% 100% 100% Decorative and Mini-Base Technol ogy <310 LUMENS 310-749 7501049 10501489 14902600 >2600 LUMEN S CFL 2% 6% 91% NA 100% 0% HAL 0% 5% 8% NA 0% 1% INC 84% 87% 2% NA 0% 98% LED Grand Total 13% 2% 0% NA 0% 0% 100% 100% 100% 100% 100% 100% 3-Way Technol ogy <310 LUMENS 310-749 7501049 10501489 14902600 >2600 LUMEN S CFL 0% NA 0% 0% 18% 0% HAL 0% NA 0% 1% 8% 0% INC 100% NA 100% 99% 71% 100% LED 0% NA 0% 0% 4% 0% Grand 100% NA 100% 100% 100% 100% Total Source: Cadeo team analysis of Northwest Energy Efficiency Alliance, “2013-2014 Northwest Residential Lighting Long-Term Market Tracking Study” January 22, 2015. Appendix II Table 15 shows the technology distribution of lamps by lumen bins and lamp types for the Neilsen sales data. It is worth noting again that this dataset represents all of 2014 and includes the sell through of lamps manufactured before the 1/1/2014 EISA deadline. For this reason, the share of incandescent lamps in this dataset is noticeably higher than in the shelf data. Table 15 Appendix II: Technology distribution of lamps stocked by lumen bins and lamp type in Neilsen sales data General Purpose Technol ogy <310 LUMENS 310-749 7501049 10501489 14902600 >2600 LUMEN S CFL 4% 15% 37% 41% 63% 16% HAL 1% 32% 31% 57% 32% 1% INC 73% 51% 31% 2% 5% 83% LED 21% 100% 1% 100% 1% 100% 0% 100% 0% 100% 0% 100% Total Globe Technol ogy <310 LUMENS 310-749 7501049 10501489 14902600 >2600 LUMEN S CFL 0% 2% 81% 49% 0% NA HAL 0% 0% 19% 0% 0% NA INC 97% 97% 0% 0% 0% NA LED Grand Total 3% 0% 0% 51% 100% NA 100% 100% 100% 100% 100% 100% Reflector and Outdoor Technol ogy <310 LUMENS 310-749 7501049 10501489 14902600 >2600 LUMEN S CFL 0% 4% 54% 21% 15% NA HAL 13% 21% 43% 77% 84% NA INC 86% 71% 0% 0% 0% NA LED Grand Total 1% 3% 3% 2% 1% NA 100% 100% 100% 100% 100% 100% Decorative and Mini-Base Technol ogy <310 LUMENS 310-749 7501049 10501489 14902600 >2600 LUMEN S CFL 0% 4% 62% 0% NA NA HAL 0% 1% 38% 0% NA NA INC 96% 95% 0% 100% NA NA LED Grand Total 4% 0% 0% 0% NA NA 100% 100% 100% 100% 100% 100% 3-Way Technol ogy <310 LUMENS 310-749 7501049 10501489 14902600 >2600 LUMEN S CFL 0% 0% 0% 1% 45% 0% HAL 0% 0% 0% 2% 3% 0% INC 100% 100% 100% 97% 51% 100% LED Grand Total 0% 0% 0% 0% 0% 0% 100% NA 100% 100% 100% 100%
