2011 Glen Robertson Annual Report
advertisement
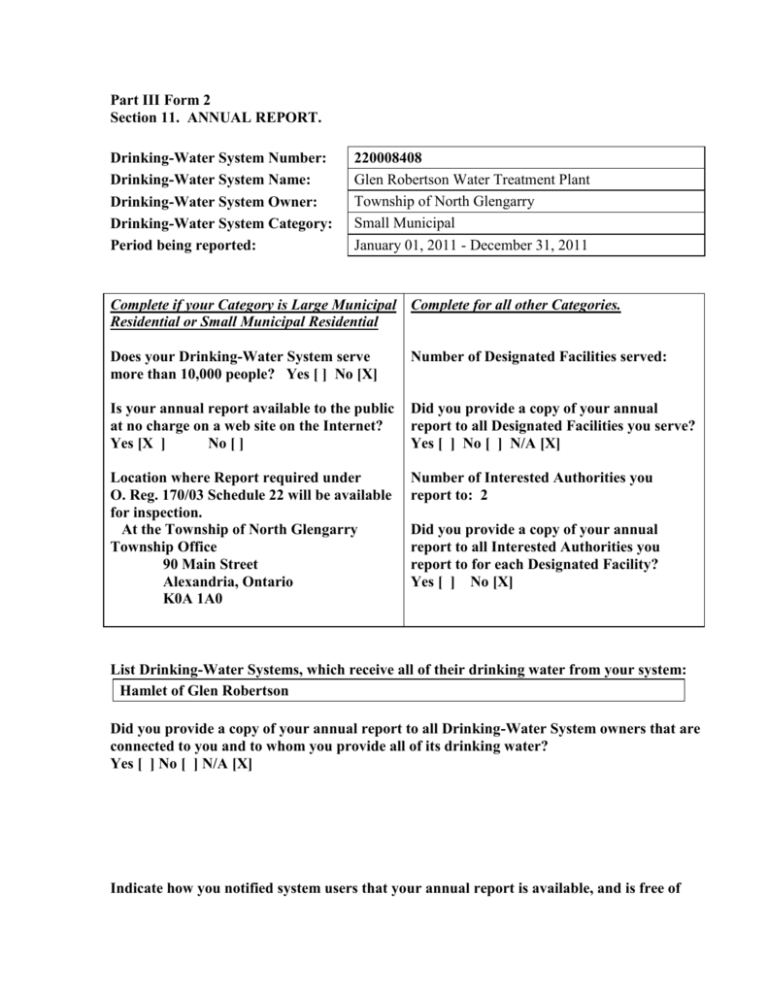
Part III Form 2 Section 11. ANNUAL REPORT. Drinking-Water System Number: Drinking-Water System Name: Drinking-Water System Owner: Drinking-Water System Category: Period being reported: 220008408 Glen Robertson Water Treatment Plant Township of North Glengarry Small Municipal January 01, 2011 - December 31, 2011 Complete if your Category is Large Municipal Complete for all other Categories. Residential or Small Municipal Residential Does your Drinking-Water System serve more than 10,000 people? Yes [ ] No [X] Number of Designated Facilities served: Is your annual report available to the public at no charge on a web site on the Internet? Yes [X ] No [ ] Did you provide a copy of your annual report to all Designated Facilities you serve? Yes [ ] No [ ] N/A [X] Location where Report required under O. Reg. 170/03 Schedule 22 will be available for inspection. At the Township of North Glengarry Township Office 90 Main Street Alexandria, Ontario K0A 1A0 Number of Interested Authorities you report to: 2 Did you provide a copy of your annual report to all Interested Authorities you report to for each Designated Facility? Yes [ ] No [X] List Drinking-Water Systems, which receive all of their drinking water from your system: Hamlet of Glen Robertson Did you provide a copy of your annual report to all Drinking-Water System owners that are connected to you and to whom you provide all of its drinking water? Yes [ ] No [ ] N/A [X] Indicate how you notified system users that your annual report is available, and is free of charge. [ X ] Public access/notice via the web [X] Public access/notice via Government Office [X] Public access/notice via a newspaper [ ] Public access/notice via Public Request [ ] Public access/notice via a Public Library [ ] Public access/notice via other method _______________________________________ Describe your Drinking-Water System Well No. 1 Well No. 1 is located at UTM Easting: 538506 UTM Northing: 5022689 (NAD 83, Accuracy +/10m). The well is a drilled 300 mm diameter groundwater well located on Irwin St. It is equipped with a submersible well pump. Rated at 5.1 L/s (67 IGPM) with a 50 mm diameter discharge. A water level monitoring unit has been installed to measure water level and temperature at 30 minute intervals. Pumping Station The actual pumping station building is an approximately 17 m.4m2, single story building which houses the treatment and control facilities including: The chlorination system utilizes two diaphragm sodium hypochlorite metering pumps with rated capacities of 0.4 L/h which discharge into the well discharge. There are 2 sodium hypochlorite storage tanks with capacities of 200 L. The tanks are also contained within secondary containment. The pumps have automatic switch over should the duty pump develop a problem during operation. One diaphragm sodium silicate metering pumps with rated capacity of 0.4 L/h at 680 kPa. and new 200 L sodium silicate storage tanks with secondary containment. The control system consists of an on line treated water turbidimeter, one treated water chlorine residual analyzer and an online flow meter. The Turbidity and chlorine monitors record on 7-day charts. All monitoring equipment is also remotely monitored and is also connected to an automatic dialer should problems be detected. There are five (5) 400 L pneumatic pressure tanks operating between 275 to 400 kPa. Piping, valves, controls and appurtenances along with associated mechanical and electrical equipment. Contact Chamber Located outside but on the property is a chlorine contact chamber consisting of 52 m of 300 mm piping located under ground complete with a treated water sample line which feeds the online chlorine residual and turbidity meters. Emergency power A 17 kW propane auto start generator capable of operating the pump house at full capacity is housed within the Water Treatment Plant. Monitoring Wells 2 drilled monitoring wells are installed with remote sensors to measure water levels at 1 hour intervals List all water treatment chemicals used over this reporting period Sodium Hypochlorite Were any significant expenses incurred to? [ ] Install required equipment [ ] Repair required equipment [ ] Replace required equipment Describe Provide details on the notices submitted in accordance with subsection 18(1) of the Safe Drinking-Water Act or section 16-4 of Schedule 16 of O.Reg.170/03 and reported to Spills Action Center? Incident Date Parameter Result Unit of Measure Corrective Action Corrective Action Date Sept 13/11 Low Cl2 .02 Mg/L Flush/ notified SAC Sept 13/11 Microbiological testing done under section 8 (2) during this reporting period Raw Treated Distribution Number of Samples Range of E.Coli or Fecal Results (#-#) Range of Total Coliform Result s (#-#) Number of HPC Samples 55 55 110 0-8 0-0 0-0 0-8 0-0 0 52 110 0 Range of HPC Results (#-#) 0-500 0-500 Operational testing done under Schedule 7, 8 or 9 during the period covered by this Annual Report. Turbidity Chlorine Number of Grab Samples Range of Results (#-#) 165 165 .10-.81 0.02-2.20 Fluoride (If the DWS provides fluoridation) NOTE: Record the unit of measure if it is not milligrams per litre. Summary of additional testing and sampling carried out in accordance with the requirement of an approval or order. Date of order or C of A Parameter Date Sampled Result Unit of Measure Summary of Inorganic parameters tested during this reporting period or most recent Parameter Sample Date Antimony July 5/11 July 5/11 July 5/11 July 5/11 July 5/11 July 5/11 July 5/11 July 5/11 July 5/11 July 5/11 July 5/11 July 5/11 July 5/11 Arsenic Barium Boron Cadmium Chromium Lead Mercury Selenium Uranium Fluoride Nitrite Nitrate Result Value <0.0001 <0.0004 0.152 0.027 <0.00002 < 0.002 <0.00002 <0.0001 0.00049 <0.1 0.4 Unit of Measure mg/L mg/L mg/L mg/L mg/L mg/L mg/L mg/L mg/L mg/L mg/L mg/L mg/L Exceedance Summary of Organic parameters sampled during this reporting period or most recent Parameter Sample Date Result Value Unit of Measure Alachlor July 5/11 July 5/11 July 5/11 July 5/11 July 5/11 July 5/11 July 5/11 July 5/11 July 5/11 July 5/11 July 5/11 July 5/11 July 5/11 July 5/11 July 5/11 July 5/11 July 5/11 July 5/11 July 5/11 July 5/11 <0.3 <3 <0.02 <0.5 <1 <3 <0.5 <0.005 <0.3 <3 <1 <.2 <0.04 <0.5 <0.5 <1 <5 <0.1 <0.2 <0.1 ug/L ug/L ug/L ug/L ug/L ug/L ug/L ug/L ug/L ug/L ug/L ug/L ug/L ug/L ug/L ug/L ug/L ug/L ug/L ug/L July 5/11 July 5/11 <0.1 <0.1 ug/L ug/L July 5/11 July 5/11 July 5/11 July 5/11 July 5/11 July 5/11 July 5/11 July 5/11 July 5/11 July 5/11 <0.3 <0.1 <5 <0.5 <1 <0.5 <5 <5 <25 ug/L ug/L ug/L ug/L ug/L ug/L ug/L ug/L ug/L Aldicarb Aldrin + Dieldrin Atrazine + N-dealkylated metobolites Azinphos-methyl Bendiocarb Benzene Benzo(a)pyrene Bromoxynil Carbaryl Carbofuran Carbon Tetrachloride Chlordane (Total) Chlorpyrifos Cyanazine Diazinon Dicamba 1,2-Dichlorobenzene 1,4-Dichlorobenzene Dichlorodiphenyltrichloroethane (DDT) + metabolites 1,2-Dichloroethane 1,1-Dichloroethylene (vinylidene chloride) Dichloromethane 2-4 Dichlorophenol 2,4-Dichlorophenoxy acetic acid (2,4-D) Diclofop-methyl Dimethoate Dinoseb Diquat Diuron Glyphosate Heptachlor + Heptachlor Epoxide Exceedance Lindane (Total) Malathion Methoxychlor Metolachlor Metribuzin Monochlorobenzene Paraquat Parathion Pentachlorophenol Phorate Picloram Polychlorinated Biphenyls(PCB) Prometryne Simazine THM (NOTE: show latest quarterly average) July 5/11 July 5/11 July 5/11 July 5/11 July 5/11 July 5/11 July 5/11 July 5/11 July 5/11 July 5/11 July 5/11 July 5/11 July 5/11 July 5/11 Oct 11/11 July 5/11 Terbufos July 5/11 Tetrachloroethylene July 5/11 2,3,4,6-Tetrachlorophenol July 5/11 Triallate July 5/11 Trichloroethylene July 5/11 2,4,6-Trichlorophenol July 5/11 2,4,5-Trichlorophenoxy acetic acid (2,4,5-T) July 5/11 Trifluralin July 5/11 Temephos <0.1 <0.1 <5 <0.1 <3 <3 <0.2 <1 <3 <0.1 <0.3 <5 <0.05 <0.1 <0.5 13.85 ug/L ug/L ug/L ug/L ug/L ug/L ug/L ug/L ug/L ug/L ug/L ug/L ug/L ug/L ug/L ug/L ug/L ug/L ug/L <0.1 ug/L <10 ug/L ug/L <0.1 ug/L <10 ug/L <0.5 ug/L Vinyl Chloride ug/L List any Inorganic or Organic parameter(s) that exceeded half the standard prescribed in Schedule 2 of Ontario Drinking Water Quality Standards. Parameter Result Value <10 <0.3 <0.2 Unit of Measure Date of Sample (Only if category is large municipal residential, small municipal residential, large municipal non residential, small municipal non residential, large non municipal non residential) Glen Robertson Water Treatment Plant Performance 2011 Annual Report Page 1 Plant Discharge Average Total Cl2 Average Consumption Average Free Cl2 m3 m3 mg/L mg/L NTU January February March April May June July August September October November December 40 33 48 45 49 53 45 35 43 35 27 39 905 701 1183 1075 1167 1089 913 818 846 804 664 808 1.82 1.57 1.40 1.33 1.44 1.42 1.47 1.52 1.43 1.55 1.66 1.61 1.94 1.75 1.61 1.50 1.58 1.49 1.59 1.69 1.53 1.66 1.84 1.76 0.41 0.38 0.25 0.23 0.25 0.20 0.23 0.30 0.27 0.19 0.31 0.21 Average Total Max Day Criteria 41 914 10973 1183 1.52 1.66 .27 1.82 1.94 .41 Date Max Daily Monthly Consumption 53 Turbidity
