Child Protection, Placement And Family Services Outcomes
advertisement
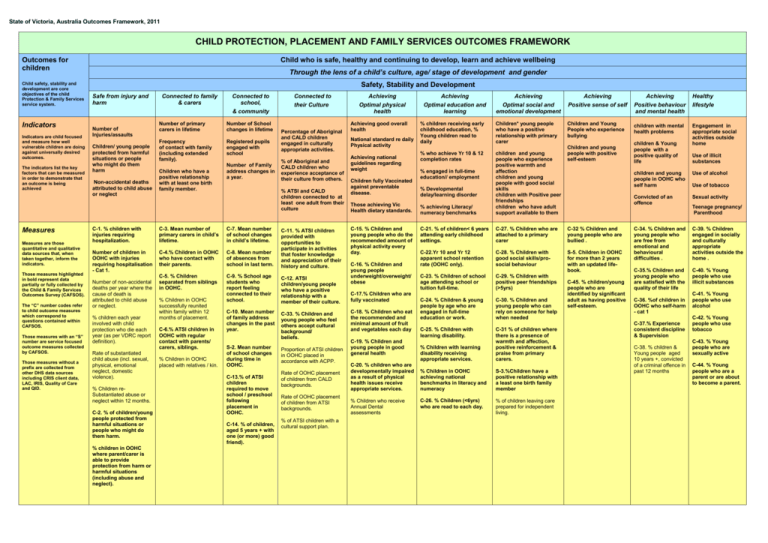
State of Victoria, Australia Outcomes Framework, 2011 CHILD PROTECTION, PLACEMENT AND FAMILY SERVICES OUTCOMES FRAMEWORK Outcomes for children Child safety, stability and development are core objectives of the child Protection & Family Services service system. Indicators Indicators are child focused and measure how well vulnerable children are doing against universally desired outcomes. The indicators list the key factors that can be measured in order to demonstrate that an outcome is being achieved Measures Measures are those quantitative and qualitative data sources that, when taken together, inform the indicators. Those measures highlighted in bold represent data partially or fully collected by the Child & Family Services Outcomes Survey (CAFSOS). The “C” number codes refer to child outcome measures which correspond to questions contained within CAFSOS. Those measures with an “S” number are service focused outcome measures collected by CAFSOS. Those measures without a prefix are collected from other DHS data sources including CRIS client data, LAC, IRIS, Quality of Care and QID. Child who is safe, healthy and continuing to develop, learn and achieve wellbeing Through the lens of a child’s culture, age/ stage of development and gender Safety, Stability and Development Safe from injury and harm Number of Injuries/assaults Children/ young people protected from harmful situations or people who might do them harm Non-accidental deaths attributed to child abuse or neglect Connected to family & carers Connected to school, & community Number of primary carers in lifetime Number of School changes in lifetime Frequency of contact with family (including extended family). Registered pupils engaged with school Children who have a positive relationship with at least one birth family member. Number of Family address changes in a year. Connected to their Culture Percentage of Aboriginal and CALD children engaged in culturally appropriate activities. % of Aboriginal and CALD children who experience acceptance of their culture from others. % ATSI and CALD children connected to at least one adult from their culture C-1. % children with injuries requiring hospitalization. C-3. Mean number of primary carers in child’s lifetime. C-7. Mean number of school changes in child’s lifetime. Number of children in OOHC with injuries requiring hospitalisation - Cat 1. C-4.% Children in OOHC who have contact with their parents. C-8. Mean number of absences from school in last term. C-11. % ATSI children provided with opportunities to participate in activities that foster knowledge and appreciation of their history and culture. C-5. % Children separated from siblings in OOHC. C-9. % School age students who report feeling connected to their school. C-12. ATSI children/young people who have a positive relationship with a member of their culture. C-10. Mean number of family address changes in the past year. C-33. % Children and young people who feel others accept cultural background/ beliefs. S-2. Mean number of school changes during time in OOHC. Proportion of ATSI children in OOHC placed in accordance with ACPP. Number of non-accidental deaths per year where the cause of death is attributed to child abuse or neglect. % children each year involved with child protection who die each year (as per VDRC report definition). Rate of substantiated child abuse (incl. sexual, physical, emotional neglect, domestic violence). % Children reSubstantiated abuse or neglect within 12 months. C-2. % of children/young people protected from harmful situations or people who might do them harm. % children in OOHC where parent/carer is able to provide protection from harm or harmful situations (including abuse and neglect). % Children in OOHC successfully reunited within family within 12 months of placement. C-6.% ATSI children in OOHC with regular contact with parents/ carers, siblings. % Children in OOHC placed with relatives / kin. C-13.% of ATSI children required to move school / preschool following placement in OOHC. C-14. % of children, aged 5 years + with one (or more) good friend). Rate of OOHC placement of children from CALD backgrounds. Rate of OOHC placement of children from ATSI backgrounds. % of ATSI children with a cultural support plan. Achieving Optimal physical health Achieving good overall health National standard re daily Physical activity Achieving Optimal education and learning % children receiving early childhood education, % Young children read to daily Achieving Positive sense of self Achieving Positive behaviour and mental health Healthy lifestyle Children* young people who have a positive relationship with primary carer Children and Young People who experience bullying children with mental health problems Children and young people with positive self-esteem children & Young people with a positive quality of life Engagement in appropriate social activities outside home Those achieving Vic Health dietary standards. % achieving Literacy/ numeracy benchmarks children and young people who experience positive warmth and affection children and young people with good social skills children with Positive peer friendships children who have adult support available to them C-15. % Children and young people who do the recommended amount of physical activity every day. C-21. % of children< 6 years attending early childhood settings. C-27. % Children who are attached to a primary carer C-32 % Children and young people who are bullied . C-22.Yr 10 and Yr 12 apparent school retention rate (OOHC only). C-28. % Children with good social skills/prosocial behaviour S-5. Children in OOHC for more than 2 years with an updated lifebook. C-23. % Children of school age attending school or tuition full-time. C-29. % Children with positive peer friendships (>5yrs) C-24. % Children & young people by age who are engaged in full-time education or work. C-30. % Children and young people who can rely on someone for help when needed Achieving national guidelines regarding weight Children fully Vaccinated against preventable disease. C-16. % Children and young people underweight/overweight/ obese C-17.% Children who are fully vaccinated C-18. % Children who eat the recommended and minimal amount of fruit and vegetables each day C-19. % Children and young people in good general health C-20. % children who are developmentally impaired as a result of physical health issues receive appropriate services. % Children who receive Annual Dental assessments % who achieve Yr 10 & 12 completion rates Achieving Optimal social and emotional development % engaged in full-time education// employment % Developmental delay/learning disorder C-25. % Children with learning disability. % Children with learning disability receiving appropriate services. C-31 % of children where there is a presence of warmth and affection, positive reinforcement & praise from primary carers. % Children in OOHC achieving national benchmarks in literacy and numeracy S-3.%Children have a positive relationship with a least one birth family member C-26. % Children (<6yrs) who are read to each day. % of children leaving care prepared for independent living. C-45. % children/young people who are identified by significant adult as having positive self-esteem. Use of illicit substances children and young people in OOHC who self harm Use of alcohol Convicted of an offence Sexual activity C-34. % Children and young people who are free from emotional and behavioural difficulties . C-39. % Children engaged in socially and culturally appropriate activities outside the home . C-35.% Children and young people who are satisfied with the quality of their life C-40. % Young people who use illicit substances C-36. %of children in OOHC who self-harm - cat 1 C-37.% Experience consistent discipline & Supervision C-38. % children & Young people aged 10 years +, convicted of a criminal offence in past 12 months Use of tobacco Teenage pregnancy/ Parenthood C-41. % Young people who use alcohol C-42. % Young people who use tobacco C-43. % Young people who are sexually active C-44. % Young people who are a parent or are about to become a parent. State of Victoria, Australia Outcomes Framework, 2011

