Relationships between vulnerability to decline, life history traits and
advertisement
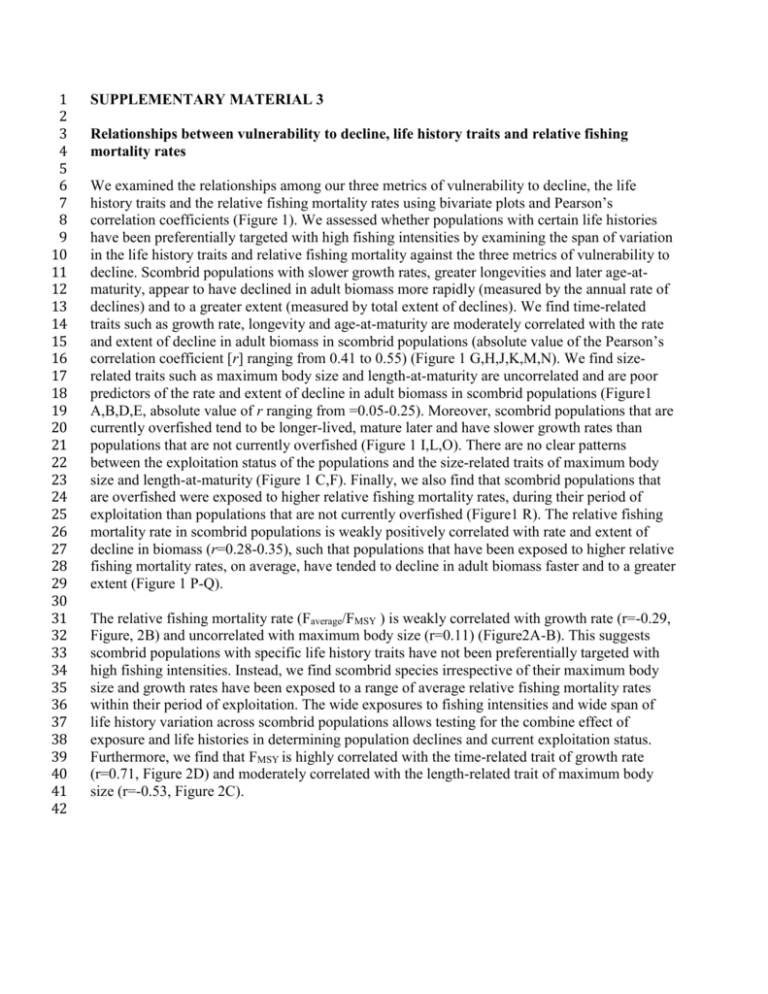
1 2 3 4 5 6 7 8 9 10 11 12 13 14 15 16 17 18 19 20 21 22 23 24 25 26 27 28 29 30 31 32 33 34 35 36 37 38 39 40 41 42 SUPPLEMENTARY MATERIAL 3 Relationships between vulnerability to decline, life history traits and relative fishing mortality rates We examined the relationships among our three metrics of vulnerability to decline, the life history traits and the relative fishing mortality rates using bivariate plots and Pearson’s correlation coefficients (Figure 1). We assessed whether populations with certain life histories have been preferentially targeted with high fishing intensities by examining the span of variation in the life history traits and relative fishing mortality against the three metrics of vulnerability to decline. Scombrid populations with slower growth rates, greater longevities and later age-atmaturity, appear to have declined in adult biomass more rapidly (measured by the annual rate of declines) and to a greater extent (measured by total extent of declines). We find time-related traits such as growth rate, longevity and age-at-maturity are moderately correlated with the rate and extent of decline in adult biomass in scombrid populations (absolute value of the Pearson’s correlation coefficient [r] ranging from 0.41 to 0.55) (Figure 1 G,H,J,K,M,N). We find sizerelated traits such as maximum body size and length-at-maturity are uncorrelated and are poor predictors of the rate and extent of decline in adult biomass in scombrid populations (Figure1 A,B,D,E, absolute value of r ranging from =0.05-0.25). Moreover, scombrid populations that are currently overfished tend to be longer-lived, mature later and have slower growth rates than populations that are not currently overfished (Figure 1 I,L,O). There are no clear patterns between the exploitation status of the populations and the size-related traits of maximum body size and length-at-maturity (Figure 1 C,F). Finally, we also find that scombrid populations that are overfished were exposed to higher relative fishing mortality rates, during their period of exploitation than populations that are not currently overfished (Figure1 R). The relative fishing mortality rate in scombrid populations is weakly positively correlated with rate and extent of decline in biomass (r=0.28-0.35), such that populations that have been exposed to higher relative fishing mortality rates, on average, have tended to decline in adult biomass faster and to a greater extent (Figure 1 P-Q). The relative fishing mortality rate (Faverage/FMSY ) is weakly correlated with growth rate (r=-0.29, Figure, 2B) and uncorrelated with maximum body size (r=0.11) (Figure2A-B). This suggests scombrid populations with specific life history traits have not been preferentially targeted with high fishing intensities. Instead, we find scombrid species irrespective of their maximum body size and growth rates have been exposed to a range of average relative fishing mortality rates within their period of exploitation. The wide exposures to fishing intensities and wide span of life history variation across scombrid populations allows testing for the combine effect of exposure and life histories in determining population declines and current exploitation status. Furthermore, we find that FMSY is highly correlated with the time-related trait of growth rate (r=0.71, Figure 2D) and moderately correlated with the length-related trait of maximum body size (r=-0.53, Figure 2C). 43 FIGURES Rate of decline Extent of decline A C Not overfished ● ● ● ● ● ● ● ● ● ● 2.4 ● ● ● ● ● ● ● ● 0.7 40 100 160 ● r=−0.25 220 280 340 100 80 60 ● ● ● ● ● ● ● ●● ● ● ● 0.7 ● ● ● ● ● ● ● 25 55 r=−0.11 85 115 100 80 ● 100 ● ● ● ● ● ● r=0.5 10 14 20 24 Extent of decline Rate of decline ● ● ● ● ● ● ● ● ● 60 55 85 ● ● ● ● ● ● ● r=−0.51 ● ● ● ● ● ● 0.7 ● 0.08 0.23 0.38 25 ● ● ● ● ● ● 2.4 ● ● ● ● ● ● ● ● ● ● 0.7 ● 1 r=0.41 3 5 10 15 20 7 9 ● ● ● ● ● ● ● ● ●● ● ● ● ● ● ● 0.23 2.4 ● ● ● ● ● ● ● ● ● 0.38 r=−0.53 ● ● ● 0.7 ● 0.2 0.4 0.7 r=0.35 0.9 ● B/Bmsy>1 1.2 1.4 1.71.9 Relative fishing mortality (Faverage/Fmsy) 20 25 30 35 40 ● ● ●● ● ●● ●● ●● ● 0.53 0.68 ● ● ● ● ● ● ● ● ● 0.08 0.23 0.38 0.53 0.68 Growth rate (1/y) ● ● ● ● ● ● ● ● ● ● ● ● 60 ● ● ● B/Bmsy>1 ●● B/Bmsy<1 ● 1 ●● ● ● ●● ● ● ● ● ● 20 ● ● ● ● ● ● ● r=0.5 3 5 7 9 11 1 3 5 7 9 11 Age at maturity (y) R 100 80 60 15 O 100 80 Extent of decline ● ● ● ● ● 10 Age at maturity (y) ● ● ● ● ●● ● Maximum age (y) Q ● ● ● Age at maturity (y) ● 5 ● 0.08 11 115 145 175205 L B/Bmsy<1 40 ● ● ● ● 25 30 35 40 20 P 9.2 7.5 5.8 4.1 ●● ● ● B/Bmsy>1 Growth rate (1/y) ● 85 r=0.55 40 0.53 0.68 ● ● ● ● ● 100 80 Extent of decline ● ● ● 55 B/Bmsy<1 20 60 ● Length at maturity (cm) N ● ● ● ● ● Growth rate (1/y) ● ● ● ● 40 M 9.2 7.5 5.8 4.1 ● 115 145 175 205 ● ● 5 Extent of decline ●● ● ● ●●● ●● ●● ●● ●● ● ● Maximum age (y) ● ● 220 280 340 r=0.13 K ● 160 I ● 30 34 40 ● ●● ● ● Maximum age (y) ● B/Bmsy>1 B/Bmsy<1 20 J 9.2 7.5 5.8 4.1 100 ● 100 80 ● ● ● 4 Rate of decline 40 Length at maturity (cm) ● ● ● ● Maximum length (cm) ● ● 25 ● ● 0.7 Rate of decline 280 340 H 2.4 Rate of decline 220 ●● ●● ● ● ● 40 145 175 205 ● ● ● r=−0.05 F Length at maturity (cm) 45 46 47 48 49 50 51 52 53 160 ● ● 60 G 9.2 7.5 5.8 4.1 ● ● B/Bmsy<1 20 ● ● ●● ● ● Overfished ● Maximum length (cm) Extent of decline Rate of decline ● ● ● ● ● 40 ● ● ●● B/Bmsy>1 ● E 2.4 44 ● ● ● ● ● ● Maximum length (cm) 2.4 ● ● ● ● ● 40 D 9.2 7.5 5.8 4.1 Exploitation status B Extent of decline Rate of decline 9.2 7.5 5.8 4.1 ● ● ● ● ● ● ● ●● ● B/Bmsy>1 ● ● ● ● B/Bmsy<1 ● 0.2 0.4 ● ●● ● ● 20 ● ● ● ● 40 ● ● ● ● 0.7 ● ● ● ● ● ● ● ● ●● r=0.28 0.9 1.2 1.4 1.71.9 Relative fishing mortality (Faverage/Fmsy) 0.2 0.4 0.7 0.9 1.21.4 1.71.9 Relative fishing mortality (Faverage/Fmsy) Figure 1 Relationships between three measures of vulnerability (columns) and each of the predictor variables (rows) in scombrid populations. The three measures of vulnerability are: average annual rate of decline in adult biomass over time (% decline per year), total extent of decline in adult biomass within the whole period of exploitation (total % decline), and current exploitation status of the populations (whether the populations are overfished [B/BMSY <1] or not [B/BMSY >1]). The predictor variables include five life history traits and the relative fishing mortality rate. Pearson’s correlation coefficients (r) and lowess smooth lines with 95% confidence intervals are shown to highlight the main patterns. A B ● r=0.11 ● Maximum size (cm) 280 220 ● ● ●● ● ● 160 ● ● ● 100 ● ● 0.68 ● ● ● Growth rate (1/year) 340 r=−0.29 ● 0.53 ● ● ● 0.38 ● ● ● ● ● ● ● ● 0.23 ● ● ● ● ● ● 0.2 0.4 0.7 0.9 1.2 1.4 ● 0.08 ● ● ● 40 1.7 1.9 0.2 0.4 Relative fishing mortality (Faverage/Fmsy) 220 ● r=−0.53 ● ● ● ● ●● ● ● ● 160 ● ● ● ● 100 ● 1.2 1.4 1.7 1.9 ● 40 0.24 Fmsy 0.44 0.64 0.84 ● 0.53 ● 0.38 ● ● 0.23 ● ● ● ● ● ● ● ● ● ● ● ● ● ● 0.08 ● ● ● r=0.71 0.68 ● 0.04 0.9 D Growth rate (1/year) Maximum size (cm) C 340 280 0.7 Relative fishing mortality (Faverage/Fmsy) 0.04 0.24 0.44 0.64 Fmsy Figure 2 Relationships between life history traits and relative fishing mortality rates (Faverage/FMSY) and FMSY in scombrid populations. (A-B) Correlations between maximum size and Von Bertalanffy growth rate and the relative fishing mortality (Faverage/FMSY), which is calculated as the ratio between the average fishing mortality rate experienced by each population within their period of exploitation and the fishing mortality predicted to provide the maximum sustainable yield (FMSY). (C-D) Correlations between maximum body size and somatic growth rate and the fishing mortality predicted to supply maximum sustainable yield (FMSY). Pearson’s correlation coefficients (r) and lowess smooth lines with 95% confidence intervals are shown to highlight the main patterns. 0.84
