SUBJECT: Algebra 1B GRADE: High School TIMELINE: 3 rd Quarter
advertisement
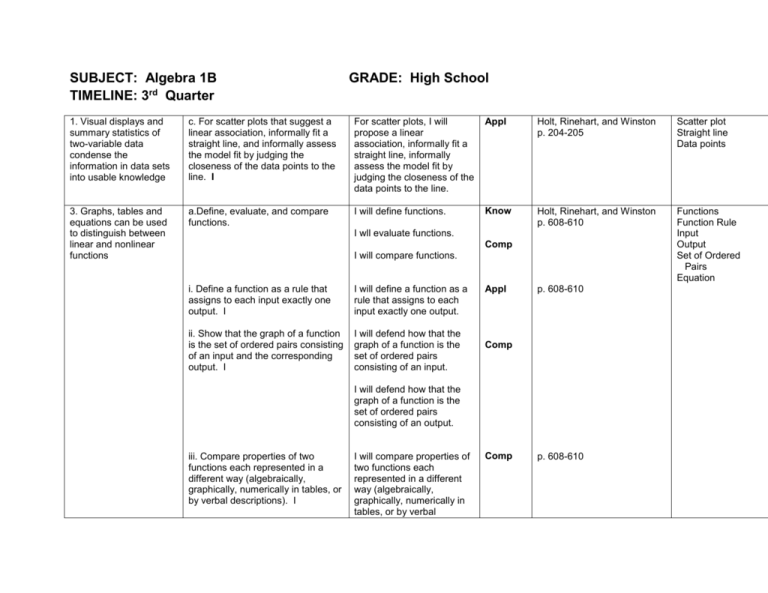
SUBJECT: Algebra 1B TIMELINE: 3rd Quarter GRADE: High School 1. Visual displays and summary statistics of two-variable data condense the information in data sets into usable knowledge c. For scatter plots that suggest a linear association, informally fit a straight line, and informally assess the model fit by judging the closeness of the data points to the line. I For scatter plots, I will propose a linear association, informally fit a straight line, informally assess the model fit by judging the closeness of the data points to the line. Appl Holt, Rinehart, and Winston p. 204-205 Scatter plot Straight line Data points 3. Graphs, tables and equations can be used to distinguish between linear and nonlinear functions a.Define, evaluate, and compare functions. I will define functions. Know Holt, Rinehart, and Winston p. 608-610 Functions Function Rule Input Output Set of Ordered Pairs Equation I wll evaluate functions. Comp I will compare functions. i. Define a function as a rule that assigns to each input exactly one output. I I will define a function as a rule that assigns to each input exactly one output. ii. Show that the graph of a function is the set of ordered pairs consisting of an input and the corresponding output. I I will defend how that the graph of a function is the set of ordered pairs consisting of an input. Appl p. 608-610 Comp I will defend how that the graph of a function is the set of ordered pairs consisting of an output. iii. Compare properties of two functions each represented in a different way (algebraically, graphically, numerically in tables, or by verbal descriptions). I I will compare properties of two functions each represented in a different way (algebraically, graphically, numerically in tables, or by verbal Comp p. 608-610 descriptions). iv. Interpret the equation y = mx + b as defining a linear function, whose graph is a straight line. I I will interpret the equation y = mx + b as defining a linear function, whose graph is a straight line. v. Give examples of functions that are not linear. I I will give examples of functions that are not linear. a. Explain a proof of the Pythagorean Theorem and its converse. I I will explain a proof of the Pythagorean Theorem and its converse. b. Apply the Pythagorean Theorem to determine unknown side lengths in right triangles in real-world and mathematical problems in two and three dimensions. I I will apply the Pythagorean Theorem to determine unknown side lengths in right triangles in real-world problems in two dimensions. Comp p. 39 p. 613 s 2. Direct and indirect measurement can be used to describe and make comparisons 2. Direct and indirect measurement can be used to describe and make comparisons I will apply the Pythagorean Theorem to determine unknown side lengths in right triangles in real-world problems in three dimensions. I will apply the Pythagorean Theorem to determine unknown side lengths in right triangles in mathematical problems in two dimensions. I will apply the Pythagorean Theorem to determine unknown side lengths in right triangles in mathematical problems in three dimensions. 3. Objects in the plane can be described and analyzed algebraically a. Express Geometric Properties with equations. 1. Use coordinates and the distance formula to compute perimeters of polygons and areas of triangles and rectangles. We will define the distance formula as it applies to the graphing of line segments. We will use the distance formula to calculate length of segments and determine perimeter of polygons. We will compute area of rectangle and triangles using the distance formula for the necessary measure to use in the formula. Know Holt McDougal Algebra 1 Pg. 743-755 Appy KUTA Algebra and Geometry software Apply Holt McDougal Algebra 1 Pg. 924
