AP BIO EQUATIONS AND FORMULAS REVIEW SHEET #1
advertisement
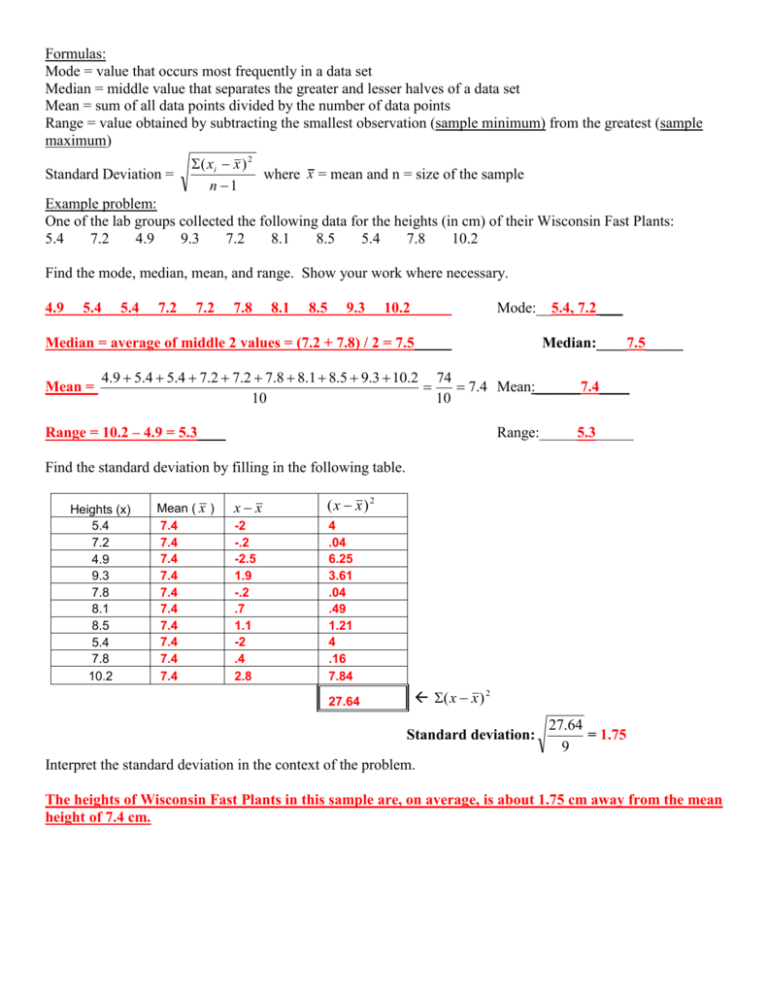
Formulas: Mode = value that occurs most frequently in a data set Median = middle value that separates the greater and lesser halves of a data set Mean = sum of all data points divided by the number of data points Range = value obtained by subtracting the smallest observation (sample minimum) from the greatest (sample maximum) Standard Deviation = ( xi x ) 2 where x = mean and n = size of the sample n 1 Example problem: One of the lab groups collected the following data for the heights (in cm) of their Wisconsin Fast Plants: 5.4 7.2 4.9 9.3 7.2 8.1 8.5 5.4 7.8 10.2 Find the mode, median, mean, and range. Show your work where necessary. 4.9 5.4 5.4 7.2 7.2 7.8 8.1 8.5 9.3 10.2 Mode:__5.4, 7.2 ___ Median = average of middle 2 values = (7.2 + 7.8) / 2 = 7.5 Mean = Median:____7.5_____ 4.9 5.4 5.4 7.2 7.2 7.8 8.1 8.5 9.3 10.2 74 7.4 Mean:______7.4____ 10 10 Range = 10.2 – 4.9 = 5.3 Range:_____5.3_____ Find the standard deviation by filling in the following table. Heights (x) 5.4 7.2 4.9 9.3 7.8 8.1 8.5 5.4 7.8 10.2 Mean ( x ) 7.4 7.4 7.4 7.4 7.4 7.4 7.4 7.4 7.4 7.4 xx (x x)2 -2 -.2 -2.5 1.9 -.2 .7 1.1 -2 .4 2.8 4 .04 6.25 3.61 .04 .49 1.21 4 .16 7.84 27.64 ( x x ) 2 Standard deviation: 27.64 = 1.75 9 Interpret the standard deviation in the context of the problem. The heights of Wisconsin Fast Plants in this sample are, on average, is about 1.75 cm away from the mean height of 7.4 cm. Formulas: Chi Square 2 (o e) 2 e o = observed individuals with observed genotype e = expected individuals with observed genotype Degrees of freedom equals the number of distinct possible outcomes minus one Degrees of Freedom p 0.05 0.01 1 3.84 6.64 2 5.99 9.32 3 7.82 11.34 4 9.49 13.28 5 11.07 15.09 6 12.59 16.81 7 14.07 18.48 8 15.51 20.09 In peas, the allele for yellow seed color (Y) is dominant to the allele for green seed color (y). A student crossed plants that came from yellow seeds with plants that came from green seeds. He believed that the yellow seeds were heterozygous. The observed results are reported in the following table. Seed color Observed Number of Seeds in F1 Yellow seeds 62 Green seeds 38 Calculate the chi-squared (2) value for the null hypothesis that the yellow seed plants were heterozygous. Express your answer to the nearest tenth. Null hypothesis – Yy x yy, expected ratio 50% Yellow, 50% Green Phenotype Yellow Green Obs 62 38 Exp 50 50 O-E 12 -12 O-E2 144 144 O-E2/E 144/50 144/50 Sum = 5.76 5.76 > 3.84, therefore Null hypothesis is rejected

