2015 Annual Progress Update - Center for Science of Information
advertisement
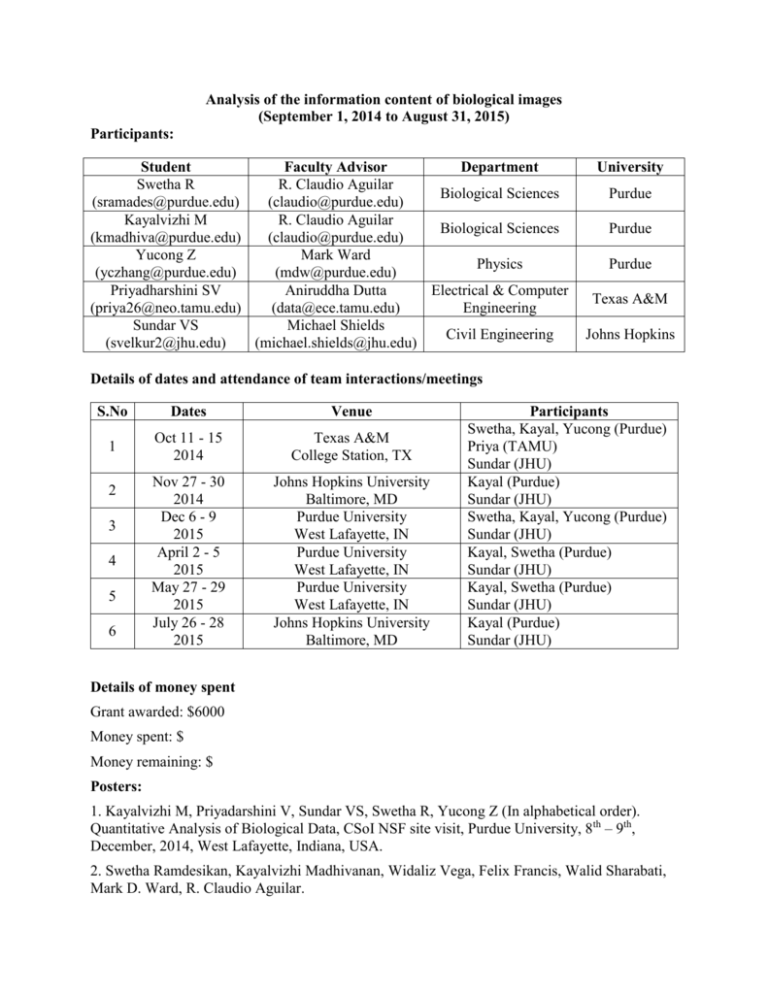
Analysis of the information content of biological images (September 1, 2014 to August 31, 2015) Participants: Student Faculty Advisor Department Swetha R R. Claudio Aguilar Biological Sciences (sramades@purdue.edu) (claudio@purdue.edu) Kayalvizhi M R. Claudio Aguilar Biological Sciences (kmadhiva@purdue.edu) (claudio@purdue.edu) Yucong Z Mark Ward Physics (yczhang@purdue.edu) (mdw@purdue.edu) Priyadharshini SV Aniruddha Dutta Electrical & Computer (priya26@neo.tamu.edu) (data@ece.tamu.edu) Engineering Sundar VS Michael Shields Civil Engineering (svelkur2@jhu.edu) (michael.shields@jhu.edu) University Purdue Purdue Purdue Texas A&M Johns Hopkins Details of dates and attendance of team interactions/meetings S.No Dates Venue 1 Oct 11 - 15 2014 Texas A&M College Station, TX Nov 27 - 30 2014 Dec 6 - 9 2015 April 2 - 5 2015 May 27 - 29 2015 July 26 - 28 2015 Johns Hopkins University Baltimore, MD Purdue University West Lafayette, IN Purdue University West Lafayette, IN Purdue University West Lafayette, IN Johns Hopkins University Baltimore, MD 2 3 4 5 6 Participants Swetha, Kayal, Yucong (Purdue) Priya (TAMU) Sundar (JHU) Kayal (Purdue) Sundar (JHU) Swetha, Kayal, Yucong (Purdue) Sundar (JHU) Kayal, Swetha (Purdue) Sundar (JHU) Kayal, Swetha (Purdue) Sundar (JHU) Kayal (Purdue) Sundar (JHU) Details of money spent Grant awarded: $6000 Money spent: $ Money remaining: $ Posters: 1. Kayalvizhi M, Priyadarshini V, Sundar VS, Swetha R, Yucong Z (In alphabetical order). Quantitative Analysis of Biological Data, CSoI NSF site visit, Purdue University, 8th – 9th, December, 2014, West Lafayette, Indiana, USA. 2. Swetha Ramdesikan, Kayalvizhi Madhivanan, Widaliz Vega, Felix Francis, Walid Sharabati, Mark D. Ward, R. Claudio Aguilar. Differential effect of OCRL1 patient mutations on protein localization, and sensitivity to FDAapproved drug suppression of cellular phenotypes associated with Lowe syndrome, Annual American Society for Cell Biology (ASCB) Conference, December 12th-16th 2015, San Diego, California, USA. Presentations: Kayalvizhi M, Swetha R, Quantitative Analysis of Biological Data, Purdue University, 14th April, 2015, West Lafayette, Indiana, USA. Introduction In order to develop novel and more efficient therapeutic approaches we need to understand disease mechanisms, which in turn requires the collection and analysis of biologically-relevant information. Unfortunately, the complex nature and high-information content of biological data, together with the lack of proper analysis methods make the information gathering and interpretation process very slow and imprecise. For example, following microscopy, image analysis is typically performed by visual examination of hundreds of cells or structures per experiment. This method, in addition to limiting the amount of samples that are to be analyzed, is not accurate and potentially poorly reproducible as it introduces human error and bias. Although some algorithms are currently available, they rely on subjective assumptions and are not suitable for widespread applications. The objective of this student-initiated proposal was to develop tools to extract and analyze quantitative biological information related to the process of cell migration. Cell migration is one of the major cellular process life scientists are focused on. On the one hand, this process is essential for normal embryo development, and indeed we discovered that defective cell migration is observed in a developmental disease called Lowe Syndrome (LS). On the other hand, enhanced cell migration of cancer cells is the cause of metastasis which currently accounts for 90% of cancer-related deaths. Cell migration requires the coordination of multiple elements of the cellular machinery. This is particularly true for the Golgi apparatus which establishes the direction of migration, and for carriers of proteins and lipids necessary for the migration-required remodeling of the cell membrane. Therefore, the availability of information such as area of the Golgi apparatus, number, density and lifetime of protein-lipid carriers in patients’ versus normal cells would be crucial for understanding and fighting diseases. Objective 1 Quantify the characteristics of the pits and plaques (protein-lipid carriers), i.e. determine the number of pits/plaques and their area. The microscopy images obtained are contaminated by noise. This noise can be filtered out by providing suitable thershold for the pixel intensity. Once this is done, the next step would be to locate the pixels with the local maxima - which, for practical purposes, gives a good estimate of the number of particles present and their locations. The figure on the right side showns the particle count from the proposed method and manual counting. The red circles denote the particles detected. After locating the particles, the next step is to obtain the area of each of these. The method followed herein is based on clustering algorithms which calculate the area of the particle as the number of pixels associated with it. Manual: 286 Code: 276 Figure 1: Result of the particle detection method The association is in terms of the relative “closeness” of the pixels to the local maxima. More details can be found here: https://www.youtube.com/watch?v=ZTWrggHxKDw. The particle detection and area calculation algorithm when applied to a cell image results in the following: (a) (b) Figure 2: (a) Local maxima and their corresponding pixels used in obtaining the area; (b) magnified version showing the local maxima and the associated pixels. Future Goals: Appropriate automatic threshold determination to rule out user interference. We wish to complete this project and submit it for a publication in the near future. Objective 2: Quantitative determination of morphological changes in Golgi Apparatus/ trans-Golgi network in Lowe Syndrome (LS) patient cells Fluorescence microscopy images of the trans-Golgi network (TGN) and nucleus of LS patient cells are obtained. The two dimensional areas of the Golgi and nucleus are manually computed and a ratio between the area of Golgi to the area of the nucleus provides a relative change in morphology of the organelle in different LS patient cells. This laborious and inconsistent process has been simplified by the development of a MATLAB-based tool. The following steps summarize the algorithm or logic behind our code: 1. When a color image is fed into the code, the ideal threshold of the various channels in the fluorescent image that will help correctly group various pixels into discrete entities is determined. 2. Upon user input, the cells that would have to be excluded or included in the analysis will be selected. 3. The centroid of the nuclei in the images is measured and a clustering function helps calculate areas of these nuclei or clustered pixels. Using the same coordinates, the centroids of corresponding trans-Golgi network (TGN) is determined and areas are calculated. 4. Output, which is the ratio of area of TGN to the area of nucleus forach cell in the image is determined. Immediate goals and future directions: Sample output of ratios of TGN area/nucleus area of healthy cells vs. LS patient cells Develop a similar approach in obtaining information such as changes in volume of the Golgi Apparatus in healthy vs. LS patient cells by processing three dimensional fluorescent microscopy images. We are confident of completing the project and publishing our approach as a research article. For more details, please visit: https://www.youtube.com/watch?v=ZTWrggHxKDw
