4_GIANT-WHR-ExtData-140919_nolegend
advertisement

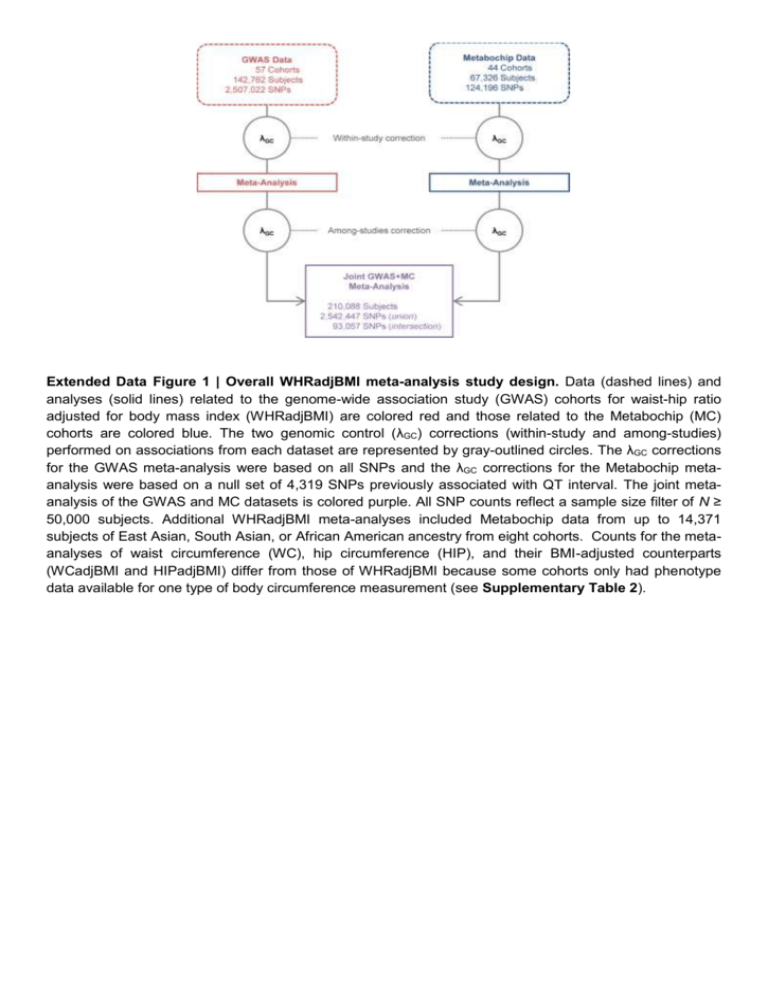
Extended Data Figure 1 | Overall WHRadjBMI meta-analysis study design. Data (dashed lines) and analyses (solid lines) related to the genome-wide association study (GWAS) cohorts for waist-hip ratio adjusted for body mass index (WHRadjBMI) are colored red and those related to the Metabochip (MC) cohorts are colored blue. The two genomic control (λGC) corrections (within-study and among-studies) performed on associations from each dataset are represented by gray-outlined circles. The λGC corrections for the GWAS meta-analysis were based on all SNPs and the λGC corrections for the Metabochip metaanalysis were based on a null set of 4,319 SNPs previously associated with QT interval. The joint metaanalysis of the GWAS and MC datasets is colored purple. All SNP counts reflect a sample size filter of N ≥ 50,000 subjects. Additional WHRadjBMI meta-analyses included Metabochip data from up to 14,371 subjects of East Asian, South Asian, or African American ancestry from eight cohorts. Counts for the metaanalyses of waist circumference (WC), hip circumference (HIP), and their BMI-adjusted counterparts (WCadjBMI and HIPadjBMI) differ from those of WHRadjBMI because some cohorts only had phenotype data available for one type of body circumference measurement (see Supplementary Table 2). Extended Data Figure 2 | Female- and male-specific effects, phenotypic variances, and genetic correlations. a, Figure showing effect beta estimates for the 20 WHRadjBMI SNPs showing significant evidence of sexual dimorphism. Sex-specific effect betas and 95% confidence intervals for SNPs associated with waist-hip ratio adjusted for body mass index (WHRadjBMI) are shown as red circles and blue squares for women and men, respectively. The SNPs are classified into three categories: (i) those showing a female-specific effect ("Women SSE"), namely a significant effect in women and no effect in men (Pwomen < 5 × 10⁻⁸, Pmen ≥ 0.05), (ii) those showing a pronounced female effect ("Women CED"), namely a significant effect in women and a less significant but directionally consistent effect in men (Pwomen < 5 × 10⁻⁸, 5 × 10⁻⁸ < Pmen ≤ 0.05); and (iii) those showing a male-specific effect ("Men SSE"), namely a significant effect in men and no effect in women (Pmen < 5 × 10⁻⁸, Pwomen ≥ 0.05). Within each of the three categories, the loci were sorted by increasing P value of sex-based heterogeneity in the effect betas. b, Figure showing standardized sex-specific phenotypic variance components for six waist-related traits. Values are shown in men (M) and women (W) from the Swedish Twin Registry (N = 11,875). The ACE models are decomposed into additive genetic components (A) shown in black, common environmental components (C) in gray, and non-shared environmental components (E) in white. Components are shown for waist circumference (WC), hip circumference (HIP), waist-hip ratio (WHR), and their body mass index (BMI)-adjusted counterparts (WCadjBMI, HIPadjBMI, and WHRadjBMI). When the A component is different in men and women with P < 0.05 for a given trait, its name is marked with an asterisk. c, Table showing genetic correlations of waistrelated traits with height, adjusted for age and body mass index. Genetic correlations of three traits with height were based on variance component models in the Framingham Heart Study and TWINGENE study (see Online Methods). WCadjBMI, waist circumference adjusted for BMI; WHRadjBMI, waist-hip ratio adjusted for BMI; HIPadjBMI, hip circumference adjusted for BMI. Extended Data Figure 3 | Cumulative genetic risk scores for WHRadjBMI applied to the KORA study cohort. a, All subjects (N = 3,440, Ptrend = 6.7 × 10⁻⁴). b, Only women (N = 1,750, Ptrend = 1.0 × 10⁻¹¹). c, Only men (N = 1,690, Ptrend = 0.02). Each genetic risk score (GRS) illustrates the joint effect of the waisthip ratio adjusted for body mass index (WHRadjBMI)-increasing alleles of the 49 identified variants from Table 1 weighted by the relative effect sizes from the applicable sex-combined or sex-specific metaanalysis. The mean WHRadjBMI residual and 95% confidence interval is plotted for each GRS category (red dots). The histograms show each GRS is normally distributed in KORA (gray bars). Extended Data Figure 4 | Heat map of unsupervised hierarchical clustering of the effects of 49 WHRadjBMI SNPs on 22 anthropometric and metabolic traits and diseases. The matrix of Z-scores representing the set of associations was scaled by row (locus name) and by column (trait) to range from –3 to 3. Negative values (blue) indicate that the waist-hip ratio adjusted for body mass index (WHRadjBMI)increasing allele was associated with decreased values of the trait and positive values (red) indicate that this allele was associated with increased values of the trait. Dendrograms indicating the clustering relationships are shown to the left and above the heat map. The WHRadjBMI-increasing alleles at the 49 lead SNPs segregate into three major clusters comprised of alleles that associate with: 1) larger waist circumference adjusted for BMI (WCadjBMI) and smaller hip circumference adjusted for BMI (HIPadjBMI) (n = 30 SNPs); 2) taller stature and larger WCadjBMI (n = 8 SNPs); and 3) shorter stature and smaller HIPadjBMI (n = 11 SNPs). The three visually identified SNP clusters could be statistically distinguished with >90% confidence. Alleles of the first cluster were predominantly associated with lower high density lipoprotein (HDL) cholesterol and with higher triglycerides and fasting insulin adjusted for BMI (FIadjBMI). eGFRcrea, estimated glomerular filtration rate based on creatinine; LDL cholesterol, low-density lipoprotein cholesterol; UACR, urine albumin-to-creatinine ratio; BMD, bone mineral density. Extended Data Figure 5 | Regulatory element overlap with WHRadjBMI-associated loci. a, Five variants associated with waist-hip ratio adjusted for body mass index (WHRadjBMI) and located ~77 kb upstream of the first CALCRL transcription start site overlap regions with genomic evidence of regulatory activity in endothelial cells. b, Five WHRadjBMI variants, including rs8817452, in a 1.1 kb region (box) ~250 kb downstream of the first LEKR1 transcription start site overlap evidence of active enhancer activity in adipose nuclei. Signal enrichment tracks are from the ENCODE Integrative Analysis and the Roadmap Epigenomics track hubs on the UCSC Genome Browser. Transcripts are from the GENCODE basic annotation. Extended Data Table 1 | WHRadjBMI loci with multiple association signals in the sex-combined and/or sex-specific approximate conditional meta-analyses P values and β coefficients for the association with WHRadjBMI from the joint model in the approximate conditional analysis of combined GWAS and Metabochip studies. SNPs selected by conditional analyses as independently associated with WHRadjBMI in a meta-analysis (sex-combined, women- or men-specific) have their respective summary statistics for these analyses marked in black and bold. SNPs not selected by a particular conditional analysis as independently associated are marked in gray and show the association analysis results for the SNP conditioned on the locus SNPs selected by GCTA. Sample sizes are from the unconditioned meta-analysis. *Locus and lead SNPs are defined by Table 1. †The effect allele is the WHRadjBMI-increasing allele in the sex-combined analysis. ‡Test for sex difference in conditional analysis based on the effect correlation estimate from primary analyses; values significant at the table-wise Bonferroni threshold of 0.05 / 25=2×10⁻³ are marked in bold. §SNPs selected by conditional analysis in the sex-combined analysis; proxies were selected by joint conditional analysis in the women- and/or menspecific analyses. ||SNP not present in the sex-specific meta-analyses due to sample size filter requiring N ≥ 50,000; sample size from GCTA. ¶At NFE2L3-SNX10, different lead SNPs were identified in the European and all-ancestry analyses but LD is reported with respect to rs10245353. Chr, chromosome; EA, effect allele; EAF, effect allele frequency. Extended Data Table 2 | Enrichments of 49 WHRadjBMI signal SNPs with metabolic and anthropometric traits The 49 waist-hip ratio adjusted for body mass index (WHRadjBMI) SNPs were tested for association with other traits by GWAS meta-analyses performed by other groups (see Online Methods). The maximum sample size available is shown overall or separately for cases/controls. N indicates the number of the total SNPs for which the WHRadjBMI-increasing allele is associated with the trait in the concordant direction (increased levels, except for HDL-C, adiponectin, and BMI). One-sided binomial P values test whether this number is greater than expected by chance (null P = 0.5 and null P = 0.025, respectively). The tests do not account for correlation between WHRadjBMI and the tested traits. P values representing significant column-wise enrichment (P < 0.05 / 23 tests) are marked in red and bold. Extended Data Table 3 | Enrichment of 49 WHRadjBMI-associated loci in epigenomic datasets Enrichment of waist-hip ratio adjusted for BMI (WHRadjBMI)-associated loci in regulatory elements from selected WHRadjBMI-relevant tissues. P values are derived using a sum of binomial distributions (see Methods). P values below a Bonferroni-corrected threshold for 60 tests of 8.3 × 10⁻⁴ are indicated in bold font. The binomial based P values are similar to P values generated from 10,000 permutation tests. Dashes indicate that datasets were not available. Extended Data Table 4 | Candidate genes at new loci associated with additional waist and hiprelated traits Candidate genes for loci shown on Table 4 based on secondary analyses or literature review. Further details are provided in other Supplementary Tables and the Supplementary Note. Loci are shown in order of chromosome and position. *Gene transcript levels associated with SNP genotype (expression QTL) in the indicated tissue(s). †Genes in pathways identified as enriched by GRAIL analysis. ‡Strongest candidate genes identified based on manual literature review. §Traits associated at P < 5 x 10⁻⁸ in GWAS lookups or in the GWAS catalog using the index SNP or a proxy in high linkage disequilibrium (LD) (r2 > 0.7), and the genes(s) named in those reports. ||Nonsynonymous variants (nsSNPs) and copy number variants (CNVs) with tag SNPs in high LD with index SNP based on a 1000 Genomes CEU reference panel. DEPICT analysis was not performed for loci associated with these traits. Chr, Chromosome; WCadjBMI, waist circumference adjusted for body mass index (BMI); HIPadjBMI, hip circumference adjusted for BMI; WHR, waist-to-hip ratio.


