GROUNDWATER - for Jack L. Pierce
advertisement

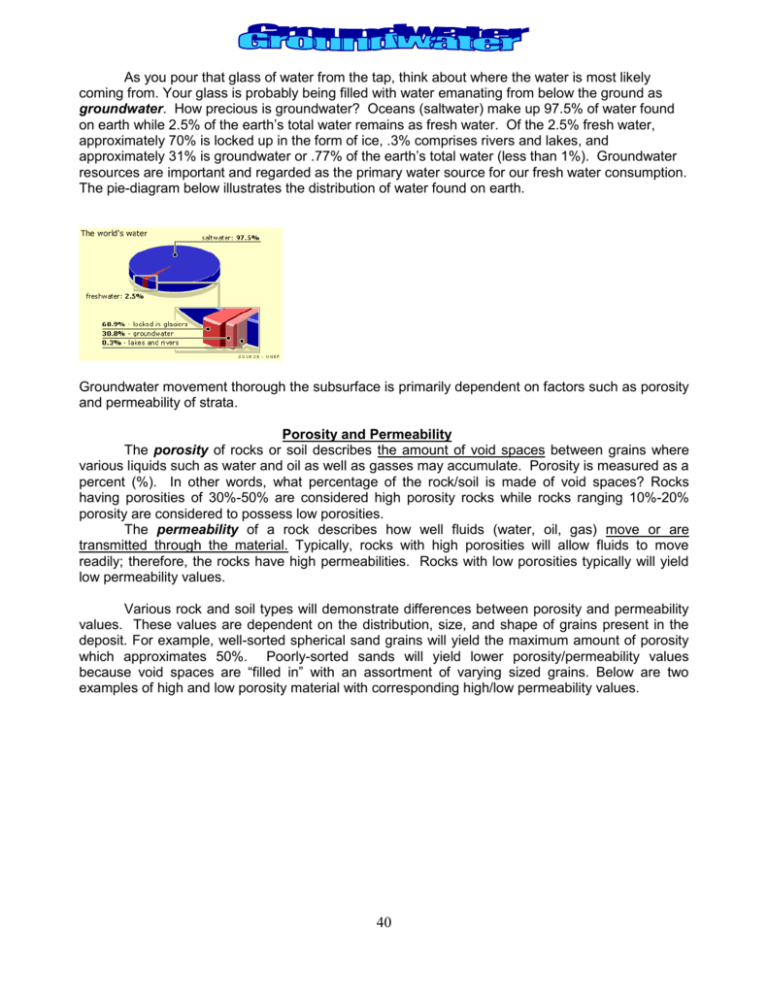
As you pour that glass of water from the tap, think about where the water is most likely coming from. Your glass is probably being filled with water emanating from below the ground as groundwater. How precious is groundwater? Oceans (saltwater) make up 97.5% of water found on earth while 2.5% of the earth’s total water remains as fresh water. Of the 2.5% fresh water, approximately 70% is locked up in the form of ice, .3% comprises rivers and lakes, and approximately 31% is groundwater or .77% of the earth’s total water (less than 1%). Groundwater resources are important and regarded as the primary water source for our fresh water consumption. The pie-diagram below illustrates the distribution of water found on earth. Groundwater movement thorough the subsurface is primarily dependent on factors such as porosity and permeability of strata. Porosity and Permeability The porosity of rocks or soil describes the amount of void spaces between grains where various liquids such as water and oil as well as gasses may accumulate. Porosity is measured as a percent (%). In other words, what percentage of the rock/soil is made of void spaces? Rocks having porosities of 30%-50% are considered high porosity rocks while rocks ranging 10%-20% porosity are considered to possess low porosities. The permeability of a rock describes how well fluids (water, oil, gas) move or are transmitted through the material. Typically, rocks with high porosities will allow fluids to move readily; therefore, the rocks have high permeabilities. Rocks with low porosities typically will yield low permeability values. Various rock and soil types will demonstrate differences between porosity and permeability values. These values are dependent on the distribution, size, and shape of grains present in the deposit. For example, well-sorted spherical sand grains will yield the maximum amount of porosity which approximates 50%. Poorly-sorted sands will yield lower porosity/permeability values because void spaces are “filled in” with an assortment of varying sized grains. Below are two examples of high and low porosity material with corresponding high/low permeability values. 40 This diagram represents abundant void spaces (high porosity) with moderate to well-sorted grains. Permeability is high. Color in the void spaces. This diagram represents limited to no void spaces (low porosity) with poorlysorted grains. Permeability is low. Color in the void spaces. In general, there are different types of rocks, soil, and sediment that have predictable porosity/permeability properties. Below is a diagram that illustrates common rocks and sediment types with their corresponding porosity/permeability properties. Porosity and permeability are highly dependant on size, shape, and sorting of grains. Typically, uniform, well-sorted sands produce high porosity/permeability values. Poorly-sorted sands yield low values. Clay particles hold large volumes of water, but permeabilities are low --- clay does not want to give up water easily. Fractured rock (basement rock, limestone) typically possesses low porosity values, and compacted shale will also contain low porosity values. Groundwater Issues Because ground water resources are vital to the human existence, scientists must understand the nature of groundwater flow, consequences of extracting groundwater, and potential contaminants entering the groundwater system creating environmental hazards. Nature of Groundwater Flow Typically, the water table represents the “water elevations” of the subsurface (below the surface) which is considered the top of the groundwater table and represented with water table contour (elevation) lines. Groundwater flow lines can be constructed by drawing lines perpendicular to water table contour lines. Groundwater flow lines indicate the direction of groundwater flow (usually flows from high elevation to low elevation). The diagram below illustrates flowing groundwater. Note, flow lines “A” and “B” are constructed perpendicular to the water table contour lines. Flow lines on the illustration below indicate groundwater is flowing from high water table elevations to lower elevations. Additionally, observe the circle labeled “C”. Here, flows lines are entering a low point in surface topography creating a flowing river. Note that flow lines form a “V” shape at the 41 groundwater and surface interface. The “V” indicates the direction of river flow. In other words, river flow is in the direction of the pointed “V.” A B Groundwater flow lines are perpendicular to the water table contour lines shown by “A” and “B.” Circle “C” shows the interface between the earth’s surface and groundwater flow – forming a flowing river. At the well, a cone of depression is formed from pumping out groundwater, changing the elevation of water table contours. water tableC contour Consequences from Extracting Groundwater Extracting or pumping groundwater for industrial and domestic uses may lead to consequences such as land subsidence. Land subsidence is characterized by “sinking land” or the lowering of the land surface topography (elevation) from changes taking place underground. Human activity such as pumping out groundwater, oil, and gas from underground reservoirs can result in land subsidence. Groundwater reservoirs in limestone formations can create dissolution, ultimately producing large underground caverns or “holes” that eventfully collapse to form sinkholes or open depressions on the earth’s surface. Other causes creating subsidence include the collapsing of underground mines and drainage of organic soils. Research has shown that land subsidence occurs in nearly every state in the union. Removing groundwater is the leading cause of land subsidence in the southwestern United States. Typically, the more groundwater withdrawal, the more land subsidence occurs. In a typical aquifer, water fills the pore spaces (moderate to high porosity) between grains of sand and gravel. When pumping an aquifer, water is removed from these pore spaces. If within the pumped aquifer there are layers of clay and silt, the decreased water pressure in the sand and gravel creates slow drainage of water from the clay and silt layers. The result of lost water pressure in the clay and silt layers decreases support for overlying strata and compression under gravity takes place ultimately causing sinking of the land surface – subsidence. Once land subsidence occurs, the process is irreversible. In other words, one cannot pump or recharge the area with water to cause the subsided land to rise. This is primarily due to porosity, permeability properties, and compressed characteristics of the clay and silt layers. Potential Contaminants Entering Groundwater Groundwater contamination takes place when man-made products are introduced into the subsurface. Products such as gasoline, oil, and agricultural chemicals are common contaminants that infiltrate overlying strata and move into the groundwater system making the resource unsafe for human consumption. Typical sources that produce groundwater contaminants are leaky storage tanks, faulty septic systems, hazardous waste sites, landfills, and agricultural products (fertilizers and pesticides). 42 Hydrogeologists are scientists that research and investigate groundwater systems in which they conduct field studies to determine the location, size, and movement of groundwater. Typically, a hydrogeologist will analyze soil, rock, and water samples from developed monitor wells to determine possible contamination to groundwater systems. In many cases where groundwater contamination has occurred, the hydrogeologist will propose a remediation plan that considers the specific type of contamination, geology of the area, and hydrologic properties (porosity, permeability, soil type, and nature of groundwater flow). Notes: 43 GROUNDWATER LAB EXCERCISES PART A: Definitions Below are essential vocabulary words. Write and learn the definition of each vocabulary word listed below. groundwater aquifer aquitard cone of depression porosity permeability land subsidence Vadose Zone Zone of Aeration Zone of Saturation Water Table 44 PART B: Porosity and Permeability Students will work in groups of two or three. Each group should have 2 empty plastic cups and 2 plastic cups labeled A and B filled with various types of materials in each cup. Before following the steps below, observe the contents in cups A and B and hypothesize which cup has the higher porosity. Hypothesis: Step 1Measure the heights of both empty cups. Mark the midpoint 50%; mark the halfway point between the base and 50% at 25%. Take cup A and insert it into an empty plastic cup. Take cup B and insert it into an empty plastic cup. Step 2In both cups A and B, pour enough water in each cup that the water level covers the top of the material, and let it settle for a couple of minutes. Prior to step 3, set your watch or “timing device” to zero and observe the time it takes for water to move though both A and B cups when completing step 3. Step 3SLOWLY remove and lift out cups A and B individually. As you are lifting each cup, allow the water to drain into empty cups directly below the water-filled cups A and B and observe the rate of flow from each sample (A and B). Step 4Calculate the percentage of water left in the empty cups. In other words, how much water occupies the empty cup given the fact that cup A and B are considered entirely full (filled with material and water)? Answer the following questions based on your above results. 1. How would you characterize the porosity of each cup? What porosity percentage values would you give each cup? Is the porosity characterized as high or low? Why? 2. As water drained from both cups A and B, how would you characterize the permeability properties of each cup? Why would one cup flow faster/slower than the other? 3. What factors influence the porosity and permeability characteristics of cups A and B? How does this observation relate to actual soils and groundwater migration? 45 4. In nature, is there any soil or rock material that achieves maximum porosity and permeability values? Why or why not? And what natural material do you think achieves maximum porosity/permeability characteristics? 5. Which materials, a box of bowling balls or box of BB’s, has more porosity? Explain your answer. 46 PART C Land Subsidence in the San Joaquin Valley The diagram below shows land subsidence in the Santa Clara Valley, California. Geologically, the valley is characterized by a large trough structure layered with interbedded, fine-grained sands and clay bounded by the Silver Creek fault to the east. Over the last decades, extensive groundwater pumping has taken place for the purpose of agricultural irrigation. Study the diagram below, and describe what has taken place over the past decades before answering the following questions. San Francisco Bay 300 Silver Fault 60 1,20 1,800 2,40 Line of equal long-term land subsidence (1934-67) (intervals of mm) A Using the diagram above, answer the following questions. 1. How much subsidence has occurred in San Jose? (1 inch = 2.54 cm) Subsidence in mm _________________ Subsidence in inches _______________ 2. Calculate the average rate of subsidence in San Jose between 1934 to 1967. Use inches/year and mm/year. (Show your work.) 3. What influence does the Silver Creek Fault have on land subsidence to the west and east of the fault? 47 4. Observing zone A on the land subsidence map, how would one interpret the closeness of subsidence contour lines? a. What does “close subsidence contours” mean? b. What might cause this type of subsidence in this area? 5. Explain why pumping groundwater back into the subsided area will not cause the land to rise and return back to its original state. Notes: 48 PART D Groundwater flow and Contamination 708 704 700 696 Faire Well N DUMP 692 BC Creek Thurston-Howe Well Barn Corral Dunn Well Bean Well 688 Using the groundwater table map above, answer the following questions. 1. Construct groundwater flow lines using the indicated water table contour lines. The dots along the 700m water table contour line are guides that each flow line will pass through. 2. Using arrows, Indicate the general direction of river flow as well as the direction of groundwater flow. Explain why the river and groundwater are flowing in the direction you have chosen. 3. Mr. Thurston and Mr. Howe claim their wells are contaminated. What evidence may support or not support their claim? If their claim is valid, what is the likely source of contamination and why? 49 4. The creek is reported to be contaminated. Where is the most likely area of creek contamination and the likely source? Why? 5. Observing the dump site location, is it likely that the Dunn well will become contaminated? Why or why not? 6. Observing the location site of the Thurston-Howe barn and corral, is it possible that animal waste infiltrating the groundwater table caused contamination to their well? Why or why not? 7. Is it possible that contamination from the Thurston-Howe barn and animal waste will contaminate other wells? Why or why not? 8. Will closing down the dump site create immediate groundwater remediation for the affected wells and portions of the BC Creek? Why or why not? 9. What types of sediment would offer porosity/permeability properties that may inhibit groundwater contamination to the affected wells? Explain and shade (on the map above) where these ideal sediments should be located. 10. You are the investigating hydrogeologist for this well site (above map), and Mr. Thurston, Mr. Howe, Mr. Bean, Mr. Dunn, and Mr. Faire are all grateful for your groundwater investigation and report. In fact, they have paid you handsomely --- $10,500 for the onemonth investigation (the power of education). Each person offers you a glass of water for your efforts. Which glass of water would you choose? You must choose wisely or suffer disastrous digestive consequences. Explain your answer. 50 Using the plate tectonic lab, write the definition for each tectonic term. Students are responsible for understanding each term prior to the plate tectonic lab. A short vocabulary quiz will be administered at the beginning of the following lab. Continental Drift Hypothesis paleomagnetism divergent boundary convergent boundary subduction zone ocean trench transform boundary San Andreas Fault Zone convection mantle convection 51


