Supplementary Material_Dec15_2014
advertisement

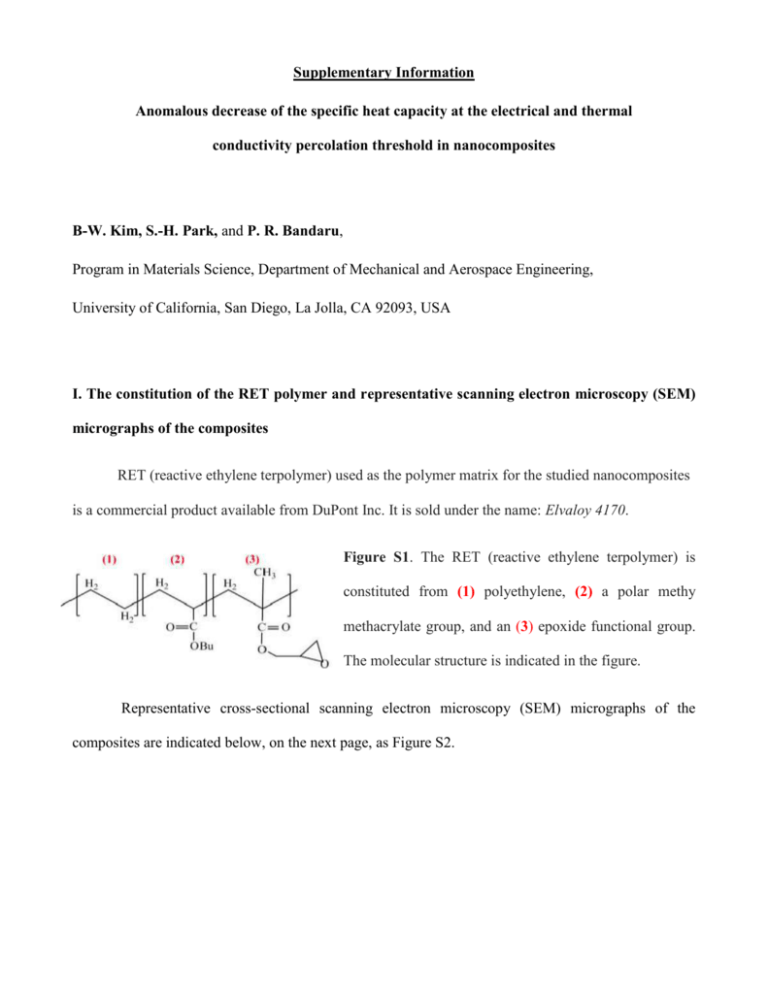
Supplementary Information Anomalous decrease of the specific heat capacity at the electrical and thermal conductivity percolation threshold in nanocomposites B-W. Kim, S.-H. Park, and P. R. Bandaru, Program in Materials Science, Department of Mechanical and Aerospace Engineering, University of California, San Diego, La Jolla, CA 92093, USA I. The constitution of the RET polymer and representative scanning electron microscopy (SEM) micrographs of the composites RET (reactive ethylene terpolymer) used as the polymer matrix for the studied nanocomposites is a commercial product available from DuPont Inc. It is sold under the name: Elvaloy 4170. Figure S1. The RET (reactive ethylene terpolymer) is constituted from (1) polyethylene, (2) a polar methy methacrylate group, and an (3) epoxide functional group. The molecular structure is indicated in the figure. Representative cross-sectional scanning electron microscopy (SEM) micrographs of the composites are indicated below, on the next page, as Figure S2. 2 Figure S2 Representative cross-sectional SEM micrographs of the nanocomposites, at close to the percolation threshold: c under (a) low magnification, and (b) high magnification. c At a higher (> c), as in (c), there is considerable agglomeration of nanotubes in the composite. In the text, we discussed that the dispersion homogeneity was monitored through scanning electron microscopy (SEM) micrographs and quantified through our development of an imageprocessing algorithm, which allowed the comparison of the obtained uniformity with that of a preferred pattern/distribution. II. Determination of the thermal conductivity and specific heat from the V (3) The thermal conductivity () was obtained from the linear part of the curve shown in the inset to Figure 2(b), which was then used as an input to the Eqn. (2) for obtaining the specific heat (C). Varying values of the )for the composite samples with different volume fractions of the carbon nanotube fillers were consequently determined and are shown in Figure 1 of the main paper. In more detail, the measured third harmonic of the applied voltage: V (3): Figure S2(a), can be converted to a temperature drop T across the sample through the relationship: DT (w ) = 2 V (3w ) , as a V (w ) derived in the paper: D.G. Cahill, Rev. Sci. Instrum. 61, 802 (1990). Subsequently, the derived T () from Eqn. (2) can be simplified to one of the form: DT (w ) = P é 1 1 æ ib 2 ö ù ln( w ) ln ê ú , where the kp l ë 2 2 çè D ÷ø û 3 first and the second terms in the brackets refer to the in-phase and the out-of-phase components - as derived from the harmonic components of the V, and measured through a lock-in amplifier. Such a simplification is valid at low frequencies, when the thermal penetration depth ( = D , where D is 2w the thermal diffusivity and ω (= f), with f as the measurement frequency) is much larger than the width of the metal line b (=35 m). (a) (b) Figure S3 (a) The results of the third harmonic of the voltage, i.e., V(3) obtained in the thermal conductivity () measurement. (b) The derived T(): black square dots, of the nanotube composites. The red solid line indicates the slope of the T() in the linear regime, corresponding to low frequencies, from which the can be estimated. Considering, for example, only the in-phase component, we find that the slope of the T() variation with ln (), at low frequencies - as depicted by the line in Figure S3(b), would be P kp l with P/l as the applied power per unit length, from which the was estimated. Subsequently, with the obtained values of for a given , for the nanocomposite, the specific heat C was obtained through a numerical solution of Eqn. (2) and a fit to the entire curve. 4 III. Representative x-ray diffractograms as a function of nanotube filler fraction ( ) in the RET polymer Figure S4: Representative XRD (x-ray diffraction) patterns with increasing a) = 0 (corresponding to the RET polymer, in the absence of nanotube fillers), (b) = 0.018 (close to the percolation threshold c), and (c) = 0.101 (corresponding to the maximum nanotube filler concentration). The peak positions indicate the relevant crystal planes of polyethylene corresponding to the RET polymer matrix. X-ray diffraction was used to determine the corresponding degree of crystalline order (defined for polymeric materials through the ratio of the integrated intensity of the crystalline peak to that of the amorphous background). The indexing of the peak positions (inset to Figure 3), observed in the diffractogram of the nanocomposite, was done to within close accord of the published patterns of the polyethylene constituents of the RET. It should be noted that the presented XRD patterns correspond to changes in the matrix crystallinity due to the filler addition and are not per se indicative of the nanotubes. It was intriguing to consider the notion that crystallinity seems to be maximal at the nanotube percolation threshold in the polymer. 5 IV. Correlation of an enhanced crystallinity to a lowered specific heat. It is well documented that the crystalline state of the polyethylene, which is a major constituent of the RET polymer used in our study, has a lower heat capacity compared to the amorphous/glassy state, near room temperature. For example, see Figure S5 below: Figure S5 The heat capacity of amorphous/glassy polyethylene is seen to be large than that of crystalline polyethylene close to room temperature. Reprinted with permission from [“Heat capacity and other thermodynamic properties of linear macromolecules”, U. Gaur and B. Wunderlich, J. Physical Chemistry Ref. Data, vol. 10, no. 1, 1981. Copyright 1981, American Institute of Physics]. While the data for the RET polymer itself is not specifically available such considerations form the basis for supposing that the specific heat of an ordered state could be lower than that of a disordered state, as suggested by the data in Figure 3. In relationship to the model proposed through Eqn. (3) in the paper, it is to be noted that we are not considering the entropy change with temperature, which would indeed be temperature dependent, as is well known, i.e., through relations of the form: (¶S / ¶T ) ~ (C / T ) , but the change with composition/nanotube content at a given/fixed temperature, as the measurements were all done close to room temperature. Indeed, the configurational entropy would be dependent on the as well as the nanotube organization and content within the polymer matrix. Considering each nanocomposite (with a different volume fraction of nanotube filler content: ) as a distinct material would yield a distinct specific heat capacity, as well. Consequently, each nanocomposite sample (with a different ) with a 6 different Cp was considered. The change of the specific heat of a particular sample with a finite (Cp, ) with respect to that of the polymer alone (Cp, ) would now be related to the change of nanotube organization and content. In summary, the concomitant observation of the enhanced crystallinity as well as the specific heat minimum at/close to the volume percolation threshold of the nanotubes seems to indicate a role more to the nanotubes and/or their influence on the RET polymer matrix. The model proposed hypothesizes that the organization of the nanotubes is responsible and appeals to this notion.


