Ch. 12 Review When checking the conditions for regression
advertisement

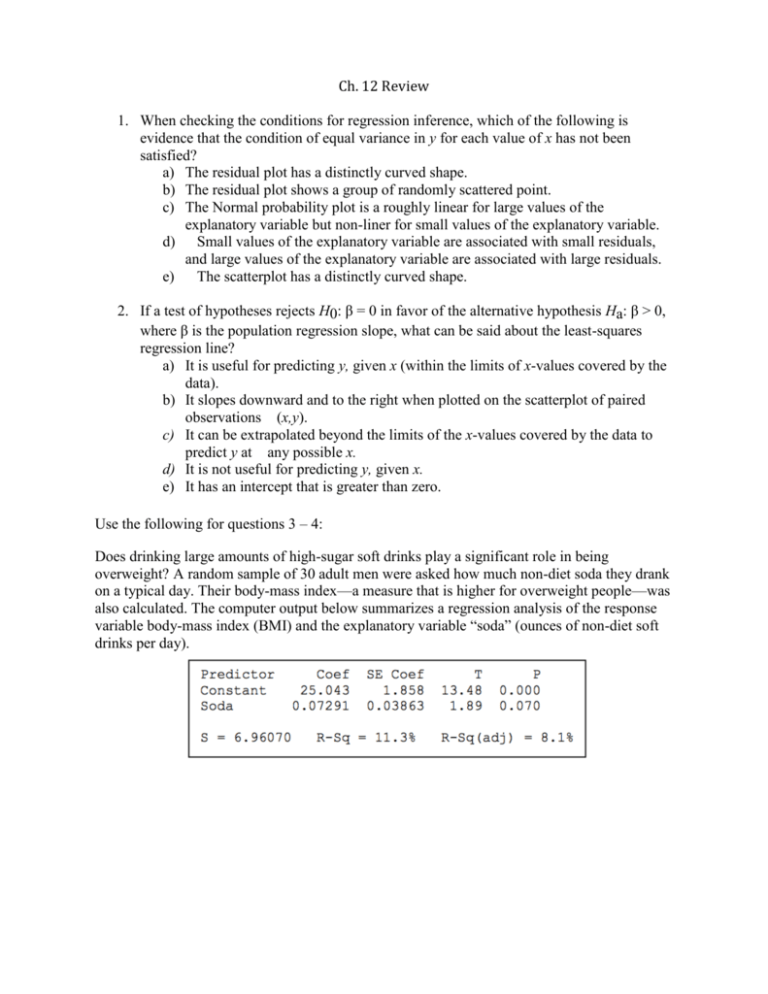
Ch. 12 Review 1. When checking the conditions for regression inference, which of the following is evidence that the condition of equal variance in y for each value of x has not been satisfied? a) The residual plot has a distinctly curved shape. b) The residual plot shows a group of randomly scattered point. c) The Normal probability plot is a roughly linear for large values of the explanatory variable but non-liner for small values of the explanatory variable. d) Small values of the explanatory variable are associated with small residuals, and large values of the explanatory variable are associated with large residuals. e) The scatterplot has a distinctly curved shape. 2. If a test of hypotheses rejects H0: β = 0 in favor of the alternative hypothesis Ha: β > 0, where β is the population regression slope, what can be said about the least-squares regression line? a) It is useful for predicting y, given x (within the limits of x-values covered by the data). b) It slopes downward and to the right when plotted on the scatterplot of paired observations (x,y). c) It can be extrapolated beyond the limits of the x-values covered by the data to predict y at any possible x. d) It is not useful for predicting y, given x. e) It has an intercept that is greater than zero. Use the following for questions 3 – 4: Does drinking large amounts of high-sugar soft drinks play a significant role in being overweight? A random sample of 30 adult men were asked how much non-diet soda they drank on a typical day. Their body-mass index—a measure that is higher for overweight people—was also calculated. The computer output below summarizes a regression analysis of the response variable body-mass index (BMI) and the explanatory variable “soda” (ounces of non-diet soft drinks per day). 3. Assuming the conditions for inference have been met, which of the following represents the 95% confidence interval for the slope of the population regression line relating BMI to soda consumption? 4. Suppose the correct calculation in question 3 produced the 95% confidence interval (a,b). Which of the following is a correct interpretation of “95% confidence”? a) In 95% of repeated samples, the slope of sample regression lines for the regression of BMI on soda will fall between a and b. b) In 95% of repeated samples, the true slope of the population regression line for the relationship between BMI and soda will fall between a and b. c) The probability that the true slope of the population regression line for the relationship between BMI and soda is in the interval (a,b) is 0.95. d) The method used to construct this confidence interval will produce an interval from a to b 95% of the time. e) The method used to construct this confidence interval will produce an interval that captures the true slope of the population regression equation 95% of the time. Use the following for questions 5 – 7: Below is a regression analysis of the number of burglaries in 2006 (response variable) on the student enrollment (explanatory variable) for 17 randomly-selected four-year public universities in the United States. Assume that the conditions for regression inference have been satisfied. 5. Which of the following is an appropriate interpretation of the number 22.5012? a) The standard deviation of the response variable “student enrollment” is 22.5012. b) The standard deviation of the explanatory variable “number of burglaries” is 22.5012. c) The typical distance between observed values for student enrollment and values for enrollment predicted by the regression equation is about 22.5012. d) The typical distance between observed values for number of burglaries and values for number of burglaries predicted by the regression equation is about 22.5012. e) The sum of the squared deviations between the observed number of burglaries and the number of burglaries predicted by the regression equation is about 22.5012. 6. Which of the following is an appropriate interpretation of the number 0.005 in the column labeled “P”? a) If H0 : β = 0 is true, the probability of getting a sample regression slope this far or farther from 0 is 0.005. b) If H0 : β = 0 is true, the probability of getting a sample regression slope this close or closer to 0 is 0.005. c) If H0 : β = 0 is true, the probability of making a Type II error is 0.005. d) The probability that H0 : β = 0 is true is 0.005. e) The probability that Ha : β ≠ 0 is false is 0.005. 7. An experiment was conducted to determine the effect of practice time (in seconds) on the percent of unfamiliar words a person could recall. The scatter plot of Percent recalled versus Practice time was strongly curved, but the scatter plot of the natural logarithm of Percent recalled versus the natural logarithm of Practice time was roughly linear. Below is a regression analysis of ln (Percent recalled) vs. ln (Practice time). Part 2: Free Response Show all your work. Indicate clearly the methods you use, because you will be graded on the correctness of your methods as well as on the accuracy and completeness of your results and explanations. 8. The standard procedure to reduce abnormally rapid heartbeats in humans is called the “diving reflex.” This entails briefly submerging the patient’s face in cold water. The reflex, triggered by cold water temperatures, is an involuntary neural response that shuts off circulation to the skin, muscles, and internal organs to divert extra oxygen-carrying blood to the heart, lungs, and brain. A research physician wants to know if there is a relationship between water temperature and how much the rate of heartbeats is reduced. He measures the effects of various cold water temperatures on the pulse rate of 7 six-year-old children. The temperature of the water (°F) is the explanatory variable, and the decrease in pulse rate (beats per minute) is the response variable. (That is, a larger positive number for the explanatory variable means a larger drop in pulse rate.) Here is computer output for a regression analysis: (a) The researcher claims that he has met the conditions for regression inference. List the conditions, and indicate what further information he should provide to support his claim. For parts (b) and (c), assume the conditions for regression inference have been satisfied. (b) Construct a 99% confidence interval for the slope of the population regression line for predicting the decrease in pulse rate (in beats per minute) from the temperature of the water (°F). (c) Does you confidence interval in (b) support the claim that there is a linear relationship between water temperature and amount of decrease in pulse rate? Justify your answer. 9. Lupe is shopping for a used car and collects data on age (in years) and price (in 1000s of dollars) for Ford Taurus sedans on a used-car web site. On this page is computer output for three different regression models: Price vs. Age, Log (Price) vs. Age, and Log (Price) vs. Log (Age). Questions about these data are on the next page. All logarithms are base 10. I. Price versus Age II. LogPriceversusAge III. Log Price versus Log age 1. Explain how the information provided suggests that a linear model may not be appropriate for describing the relationship between car age and price. 2. Would an exponential model or a power model provide a better description of this relationship? Use the information provided to justify your answer. 3. Give the equation of the model you chose in Question 2, using the transformed variable(s). 4. Use the model you chose in Question 2 to predict the price of a 5-year-old Ford Taurus. Show your work!


