Mth 86 Project #1
advertisement
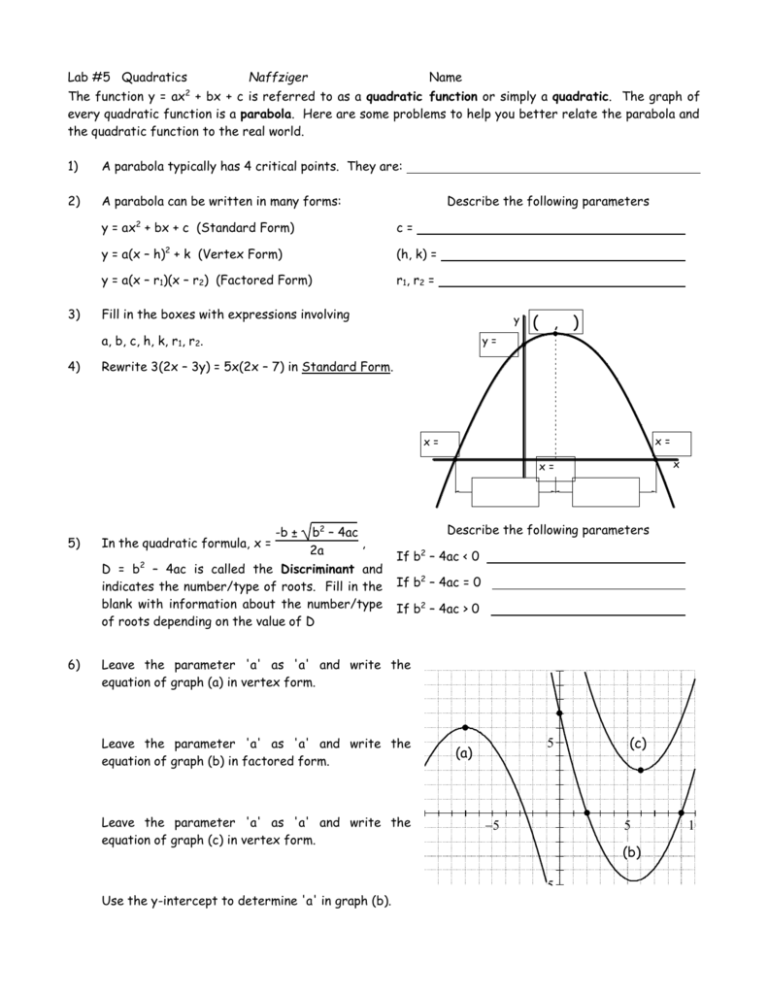
Lab #5 Quadratics Naffziger Name 2 The function y = ax + bx + c is referred to as a quadratic function or simply a quadratic. The graph of every quadratic function is a parabola. Here are some problems to help you better relate the parabola and the quadratic function to the real world. 1) A parabola typically has 4 critical points. They are: 2) A parabola can be written in many forms: 3) Describe the following parameters y = ax2 + bx + c (Standard Form) c= y = a(x – h)2 + k (Vertex Form) (h, k) = y = a(x – r1)(x – r2) (Factored Form) r1, r2 = Fill in the boxes with expressions involving y a, b, c, h, k, r1, r2. 4) ( , ) y= Rewrite 3(2x – 3y) = 5x(2x – 7) in Standard Form. x= x= x x= 5) 6) b2 – 4ac , 2a D = b2 – 4ac is called the Discriminant and indicates the number/type of roots. Fill in the blank with information about the number/type of roots depending on the value of D In the quadratic formula, x = Describe the following parameters -b ± If b2 – 4ac < 0 If b2 – 4ac = 0 If b2 – 4ac > 0 Leave the parameter 'a' as 'a' and write the equation of graph (a) in vertex form. Leave the parameter 'a' as 'a' and write the equation of graph (b) in factored form. Leave the parameter 'a' as 'a' and write the equation of graph (c) in vertex form. Use the y-intercept to determine 'a' in graph (b). (a) (c) (b) Trajectories follow a parabola. A ball is hit from 40' toward an 8' tall goal. The ball reaches its peak 25' from the kicker with a height of 11.3'. Find the equation for the trajectory and decide if the kicker scores. 8) Fred wants to build a rectangular paddock using 120' of fencing. One side of the paddock already has a fence so he only needs to put fence on 3 sides. Using the variables shown, (a) write an equation for the amount of fence. (b) Write an equation for the area. goal 7) paddock y x (c) Use substitution to find a quadratic for the area of the form A = ax 2 + bx + c. (d) Graph your quadratic and determine the dimension of the paddock with the largest area. 9) Consider (3x – 1)(2x + 5) = 4x + 55. Solve the equation in 3 ways: (a) by the Quadratic Formula, (b) by graphing (c) by factoring. 10) Here is some data collected giving average pollen count. Day refers to day of the month of April. Before plotting the information in the T-table we must decide which the independent/dependent variable. a) Which variable is the dependent variable? b) Plot the data. Interpret and describe what is physically occurring according to the data. Use everyday vocabulary normally associated with a person's health. Day 1 5 10 15 20 Pollen 5 15 40 50 53 c) Use you calculator to run quadratic regression to find the model for the pollen count. Write your result here. d) When will the pollen count reach zero?
