Summary of the Predictive Relationship between the FAIR and the
advertisement
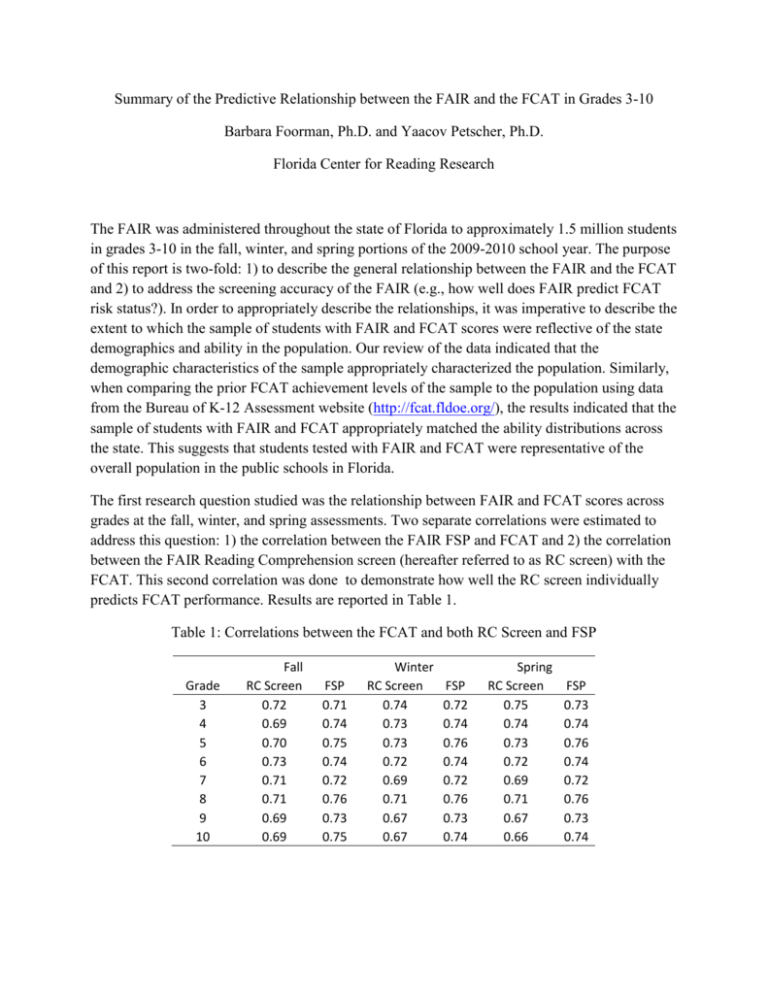
Summary of the Predictive Relationship between the FAIR and the FCAT in Grades 3-10 Barbara Foorman, Ph.D. and Yaacov Petscher, Ph.D. Florida Center for Reading Research The FAIR was administered throughout the state of Florida to approximately 1.5 million students in grades 3-10 in the fall, winter, and spring portions of the 2009-2010 school year. The purpose of this report is two-fold: 1) to describe the general relationship between the FAIR and the FCAT and 2) to address the screening accuracy of the FAIR (e.g., how well does FAIR predict FCAT risk status?). In order to appropriately describe the relationships, it was imperative to describe the extent to which the sample of students with FAIR and FCAT scores were reflective of the state demographics and ability in the population. Our review of the data indicated that the demographic characteristics of the sample appropriately characterized the population. Similarly, when comparing the prior FCAT achievement levels of the sample to the population using data from the Bureau of K-12 Assessment website (http://fcat.fldoe.org/), the results indicated that the sample of students with FAIR and FCAT appropriately matched the ability distributions across the state. This suggests that students tested with FAIR and FCAT were representative of the overall population in the public schools in Florida. The first research question studied was the relationship between FAIR and FCAT scores across grades at the fall, winter, and spring assessments. Two separate correlations were estimated to address this question: 1) the correlation between the FAIR FSP and FCAT and 2) the correlation between the FAIR Reading Comprehension screen (hereafter referred to as RC screen) with the FCAT. This second correlation was done to demonstrate how well the RC screen individually predicts FCAT performance. Results are reported in Table 1. Table 1: Correlations between the FCAT and both RC Screen and FSP Grade 3 4 5 6 7 8 9 10 Fall RC Screen 0.72 0.69 0.70 0.73 0.71 0.71 0.69 0.69 FSP 0.71 0.74 0.75 0.74 0.72 0.76 0.73 0.75 Winter RC Screen 0.74 0.73 0.73 0.72 0.69 0.71 0.67 0.67 FSP 0.72 0.74 0.76 0.74 0.72 0.76 0.73 0.74 Spring RC Screen 0.75 0.74 0.73 0.72 0.69 0.71 0.67 0.66 FSP 0.73 0.74 0.76 0.74 0.72 0.76 0.73 0.74 The correlations across each grade demonstrated strong relationships between the RC Screen and FCAT, as well as between FSP and FCAT. As expected, the FSP correlation with FCAT was stronger than the relationship between RC screen with FCAT because the prior FCAT score was included in the calculation of FSP. The correlations indicate that both score types strongly predict to end of the year FCAT performance. The second question addressed the extent to which FSP scores greater or equal to 0.85 (green zone) at each assessment period corresponded to passing the FCAT. Results are presented in Table 2. Table 2: Screening Accuracy of the FAIR predicting FCAT success Fall Grade 3 4 5 6 7 8 9 10 FSP = 0.85 0.99 0.98 0.97 0.97 0.94 0.90 0.93 0.84 FSP = 0.70 0.98 0.95 0.91 0.92 0.88 0.80 0.84 0.74 Winter FSP = FSP = 0.85 0.70 0.98 0.97 0.98 0.94 0.96 0.91 0.97 0.93 0.94 0.88 0.90 0.79 0.92 0.84 0.84 0.72 Spring FSP = FSP = 0.85 0.70 0.98 0.96 0.97 0.94 0.96 0.90 0.97 0.92 0.94 0.88 0.89 0.79 0.92 0.83 0.84 0.72 % < Level 3 FCAT 28 31 33 41 39 53 59 69 With the exception of grade 8 in the spring and grade 10 at each assessment period, more than 90% of students who obtained an FSP of at least 0.85 at any time point passed the FCAT at level 3 or above. In tenth grade, 84% of students with an FSP >= 0.85 passed the FCAT. Given that nearly 70% of students in tenth grade did not pass the FCAT (see right hand column of Table 2), it was not surprising that fewer students with high FSPs passed the FCAT. A secondary analysis of the predictive power of the FSP used a cut-point of 0.70. At this level of proficiency (yellow zone), a strong prediction of FCAT success still existed; however, it was lower at the upper-grades than in elementary school. Thus, it is advisable to keep the lower bound of the green zone at a proficiency level of FSP>=0.85 rather than extending the green zone down to FSP>=0.70. The results from these analyses lend support for the continued use of the FAIR RC screen as a tool to identify students throughout the year who are likely to pass the FCAT.


