Kepler: A Search for Terrestrial Planets
advertisement
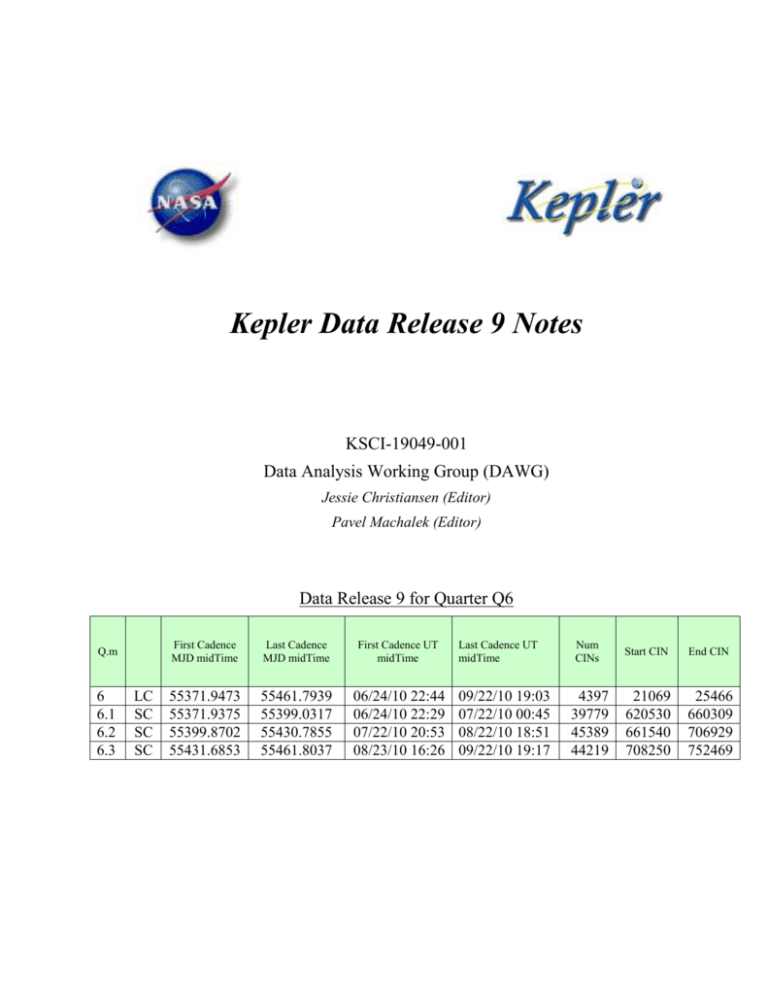
Kepler Data Release 9 Notes KSCI-19049-001 Data Analysis Working Group (DAWG) Jessie Christiansen (Editor) Pavel Machalek (Editor) Data Release 9 for Quarter Q6 Q.m 6 6.1 6.2 6.3 LC SC SC SC First Cadence MJD midTime Last Cadence MJD midTime First Cadence UT midTime 55371.9473 55371.9375 55399.8702 55431.6853 55461.7939 55399.0317 55430.7855 55461.8037 06/24/10 22:44 06/24/10 22:29 07/22/10 20:53 08/23/10 16:26 Last Cadence UT midTime 09/22/10 19:03 07/22/10 00:45 08/22/10 18:51 09/22/10 19:17 Num CINs Start CIN End CIN 4397 39779 45389 44219 21069 620530 661540 708250 25466 660309 706929 752469 KSCI-19049-001: Kepler Data Release 9 Notes Prepared by: _______________________________________ Date __________ Jessie Christiansen, Kepler Science Office, for the DAWG (next page) Prepared by: _______________________________________ Date __________ Pavel Machalek, Kepler Science Office, for the DAWG (next page) Approved by: _______________________________________ Date __________ Jeffrey Van Cleve, Editor-in-Chief Approved by: _______________________________________ Date __________ Jon Jenkins, Co-I for Data Analysis & DAWG Lead Approved by: _______________________________________ Date __________ Michael R. Haas, Science Office Director 2 of 25 KSCI-19049-001: Kepler Data Release 9 Notes Document Control Ownership This document is part of the Kepler Project Documentation that is controlled by the Kepler Project Office, NASA/Ames Research Center, Moffett Field, California. Control Level This document will be controlled under KPO @ Ames Configuration Management system. Changes to this document shall be controlled. Physical Location The physical location of this document will be in the KPO @ Ames Data Center. Distribution Requests To be placed on the distribution list for additional revisions of this document, please address your request to the Kepler Science Office: Michael R. Haas Kepler Science Office Director MS 244-30 NASA Ames Research Center Moffett Field, CA 94035-1000 Michael.R.Haas@nasa.gov 3 of 25 KSCI-19049-001: Kepler Data Release 9 Notes The Data Characteristics Handbook is the collective effort of the Data Analysis Working Group (DAWG), composed of Science Office (SO), Science Operations Center (SOC), Guest Observer Office (GO), and Science Team (ST) members as listed below: Jon Jenkins*, Chair Doug Caldwell*, Co-Chair Allen, Christopher L. Bryson, Stephen T. Christiansen, Jessie L. Clarke, Bruce D. Cote, Miles T. Fanelli, Michael N. Gilliland*, Ron (STSci) Girouard, Forrest Haas, Michael R. Hall, Jennifer Ibrahim, Khadeejah Kinemuchi, Karen Klaus, Todd Kolodziejczak, Jeff (MSFC) Li, Jie Machalek, Pavel McCauliff, Sean D. Middour, Christopher K. Morris, Rob Mullally, Fergal Quintana, Elisa V. Rowe, Jason Seader, Shawn Smith, Jeffrey Claiborne Still, Martin Tenenbaum, Peter G. Thompson, Susan E. Twicken, Joe Uddin, Akm Kamal Van Cleve, Jeffrey Wohler, Bill *Science Team 4 of 25 KSCI-19049-001: Kepler Data Release 9 Notes Table of Contents Prefatory Admonition to Users ................................................................................. 6 1. Introduction ..................................................................................................... 7 1.1 Dates, Cadence numbers, and units................................................................ 7 2. Release Description .......................................................................................... 8 3. Evaluation of Performance ................................................................................. 9 3.1 4. 5. Overall ....................................................................................................... 9 Historical Events ............................................................................................ 11 4.1 Kepler mission timeline to date ................................................................... 11 4.2 Safe Mode ................................................................................................ 11 4.3 Loss of Fine Point ..................................................................................... 11 4.4 4.5 Attitude Tweaks ........................................................................................ 12 Variable FGS Guide Stars .......................................................................... 12 4.6 Module 3 Failure ....................................................................................... 12 Ongoing Phenomena ....................................................................................... 13 5.1 Image Motion ........................................................................................... 13 5.2 Focus Drift and Jitter ................................................................................. 14 5.3 Momentum Desaturation ............................................................................ 14 5.4 Reaction Wheel Zero Crossings .................................................................. 16 5.5 Downlink Earth Point ................................................................................ 16 5.6 Manually Excluded Cadences ..................................................................... 16 5.7 Incomplete Apertures Give Flux and Feature Discontinuities at Quarter Boundaries........................................................................................................ 16 5.8 5.9 Argabrightening ........................................................................................ 17 Background Time Series ............................................................................ 19 5.10 Pixel Sensitivity Dropouts ........................................................................ 19 5.11 Short Cadence Requantization Gaps .......................................................... 19 5.12 Spurious Frequencies in SC Data............................................................... 19 5.13 Anomaly Summary Table ......................................................................... 20 6. Time and Time Stamps .................................................................................... 22 7. Contents of Supplement................................................................................... 23 8. References ..................................................................................................... 25 5 of 25 KSCI-19049-001: Kepler Data Release 9 Notes Prefatory Admonition to Users The corrected light-curve product generated by the PDC (Pre-search Data Conditioning) pipeline module is designed to enable the Kepler planetary transit search. Although significant effort has been expended to preserve the natural variability of targets in the corrected light curves in order to enable astrophysical exploitation of the Kepler data, it is not possible to perfectly preserve general stellar variability on long timescales with amplitudes comparable to or smaller than the instrumental systematics, and PDC currently is known to remove or distort astrophysical features in a subset of the corrected light curves. In those cases where PDC fails, or where the requirements of an astrophysical investigation are in conflict with those for transit planet search, the investigator should use the ‘raw’ light-curve product, for which basic calibration has been performed but correction for instrumental systematics has not, instead of the PDC (‘corrected’) light-curve product. Where appropriate, the investigator can then use the ancillary engineering data and image motion time series provided in the relevant Data Release Notes Supplement/s for systematic error correction. Investigators are strongly encouraged to study the Data Characteristics Handbook and Data Release Notes for any data sets they intend to use. The Science Office advises against publication of results based on Kepler light curves without careful consideration and due diligence by the end user, and dialog with the Science Office or Guest Observer Office where appropriate. Users are encouraged to notice and document artifacts, either in the raw or processed data, and report them to the Science Office at kepler-scienceoffice@lists.nasa.gov. Users who neglect this Admonition risk seeing their works crumble into ruin before their time. 6 of 25 KSCI-19049-001: Kepler Data Release 9 Notes Introduction These Data Release Notes provide information specific to the quarter of data currently being released. They have been drastically shortened relative to previous versions. The companion text has been moved to the Kepler Data Characterization Handbook (KSCI19040). The section numbers and titles are identical in these Notes and that Handbook to assist the reader. 1.1 Dates, Cadence numbers, and units Table 1: Contents of Release 9. CIN is the cadence interval number. All Release 9 cadence data were processed under KSOP-652 with SOC Pipeline 6.2, revision number r40414. Q.m 6 6.1 6.2 6.3 LC SC SC SC First Cadence MJD midTime Last Cadence MJD midTime First Cadence UT midTime Last Cadence UT midTime Num CINs Start CIN End CIN 55371.9473 55371.9375 55399.8702 55431.6853 55461.7939 55399.0317 55430.7855 55461.8037 06/24/10 22:44 06/24/10 22:29 07/22/10 20:53 08/23/10 16:26 09/22/10 19:03 07/22/10 00:45 08/22/10 18:51 09/22/10 19:17 4397 39779 45389 44219 21069 620530 661540 708250 25466 660309 706929 752469 7 of 25 KSCI-19049-001: Kepler Data Release 9 Notes Release Description No changes from the Data Characteristics Handbook. 8 of 25 KSCI-19049-001: Kepler Data Release 9 Notes Evaluation of Performance 1.2 Overall Figure 1: 6.5 hr Temporal Median (TM) of the Quarter 6 CDPP time series calculated by the TPS pipeline module for stars between 9th and 13.5th magnitude. The 6 hr TMCDPPs have been divided by sqrt(13/12) = 1.041 to approximate 6.5 hr TMCDPPs. Stars on the planetary target list with Kepler Magnitude < 13.5 and log g > 4, which are almost certainly dwarf stars, are shown as green +'s; other stars are marked with blue +'s. 9 of 25 KSCI-19049-001: Kepler Data Release 9 Notes Table 2: Aggregate Statistics for the TMCDPPs plotted in Figure 1: 6.5 hr Temporal Median (TM) of the Quarter 6 CDPP time series calculated by the TPS pipeline module for stars between 9th and 13.5th magnitude. The 6 hr TMCDPPs have been divided by sqrt(13/12) = 1.041 to approximate 6.5 hr TMCDPPs. Stars on the planetary target list with Kepler Magnitude < 13.5 and log g > 4, which are almost certainly dwarf stars, are shown as green +'s; other stars are marked with blue +'s.. Column Definitions: (1) Kepler Magnitude at center of bin. Bins are +/- 0.25 mag, for a bin of width 0.5 mag centered on this value. (2) Number of dwarfs (log g > 4) in bin. (3) 10th percentile TMCDPP for dwarfs in bin. (4) Median TMCDPP for dwarfs in bin. (5) Number of all stars in bin. (6) 10th percentile TMCDPP of all observed stars in bin. (7) Median TMCDPP for all stars in bin. (8) Simplified noise model CDPP. 10th percentile CDPP, dwarfs Number of dwarfs in bin 9 31 9.8 37 180 13.2 89.5 3.8 10 160 12.1 34.6 567 14.7 100.3 6 11 607 18.5 33.8 1707 21.4 94.2 9.5 12 2169 24.9 39.2 4385 27 69.5 15.2 13 6767 36.4 50.9 10645 38.2 64.7 24.4 10 of 25 Median CDPP, dwarfs Number of all stars in bin 10th percentile CDPP, all stars Kepler mag at bin center Median CDPP, all stars Lower envelope of model CDPP KSCI-19049-001: Kepler Data Release 9 Notes Historical Events In this Section, we discuss cadences that may be lost to high-precision photometry due to planned or unplanned spacecraft events. 1.3 Kepler mission timeline to date Figure 2: Kepler Mission Timeline as of end of Q6. 1.4 Safe Mode No changes from the Data Characteristics Handbook. 1.5 Loss of Fine Point No changes from the Data Characteristics Handbook. 11 of 25 KSCI-19049-001: Kepler Data Release 9 Notes 1.6 Attitude Tweaks Figure 3: Attitude Error in Quarter 6, calculated by PAD using Long Cadence data. 1.7 Variable FGS Guide Stars No changes from the Data Characteristics Handbook. 1.8 Module 3 Failure No changes from the Data Characteristics Handbook. 12 of 25 KSCI-19049-001: Kepler Data Release 9 Notes Ongoing Phenomena 1.9 Image Motion Figure 4: Mod out 2.1 Center motion time series. The gaps are monthly Earth contacts. 13 of 25 KSCI-19049-001: Kepler Data Release 9 Notes 1.10 Focus Drift and Jitter Figure 5: Correlation of variation in PRF width with various spacecraft temperatures, demonstrating the seasonal nature of focus and PRF changes. 1.11 Momentum Desaturation Table 3: Momentum dumps in Q6 and the corresponding Long and Short Cadences. CIN = cadence interval number, RCI = relative cadence index. LC CIN 21150 21296 21442 21588 21734 21880 22026 22172 22318 22393 22538 22684 22830 22976 23122 23268 14 of 25 RCI 82 228 374 520 666 812 958 1104 1250 1325 1470 1616 1762 1908 2054 2200 Date(MJD) 55373.60245 55376.58576 55379.56906 55382.55237 55385.53567 55388.51898 55391.50229 55394.48559 55397.46890 55399.00142 55401.96429 55404.94760 55407.93090 55410.91421 55413.89752 55416.88082 KSCI-19049-001: Kepler Data Release 9 Notes 23414 23560 23706 23852 23947 24093 24239 24385 24531 24677 24822 24968 25114 25260 25406 25465 SC CIN 2346 2492 2638 2784 2879 3025 3171 3317 3463 3609 3754 3900 4046 4192 4338 4397 RCI 55419.86413 55422.84743 55425.83074 55428.81405 55430.75524 55433.73852 55436.72183 55439.70514 55442.68844 55445.67175 55448.63462 55451.61793 55454.60123 55457.58454 55460.56784 55461.77343 Date(MJD) (Month 1) 622970 2441 622971 2442 627350 6821 627351 6822 631730 11201 631731 11202 636110 15581 636111 15582 640490 19961 640491 19962 644870 24341 644871 24342 649250 28721 653630 33101 658010 37481 660260 39731 55373.59938 55373.60007 55376.58269 55376.58337 55379.56600 55379.56668 55382.54930 55382.54998 55385.53261 55385.53329 55388.51592 55388.51660 55391.49922 55394.48253 55397.46583 55398.99835 (Month 2) 664610 3071 668990 7451 673370 11831 677750 16211 682130 20591 686510 24971 690890 29351 695270 33731 699650 38111 704030 42491 706880 45341 55401.96123 55404.94453 55407.92784 55410.91115 55413.89445 55416.87776 55419.86106 55422.84437 55425.82768 55428.81098 55430.75217 15 of 25 KSCI-19049-001: Kepler Data Release 9 Notes (Month 3) 711260 3011 715640 7391 720020 11771 720021 11772 724400 16151 728780 20531 733130 24881 733131 24882 737510 29261 737511 29262 741890 33641 741891 33642 746270 38021 746271 38022 750650 42401 750651 42402 752420 44171 55433.73546 55436.71876 55439.70207 55439.70275 55442.68538 55445.66868 55448.63156 55448.63224 55451.61486 55451.61554 55454.59817 55454.59885 55457.58147 55457.58215 55460.56478 55460.56546 55461.77036 1.12 Reaction Wheel Zero Crossings Table 4: Zero crossing events in Q6, defined as the time from first to last zero crossing in the event, rounded to the nearest Cadence. The corresponding cadence numbers for SC are in the supplement. Event # MJD Start MJD End CIN Start CIN End RCI Start RCI End NumTLM Samp 1 55379.569 55379.957 21442 21461 374 393 280 2 55382.552 55382.695 21588 21595 520 527 103 3 55388.499 55388.601 21879 21884 811 816 55 4 55397.469 55397.510 22318 22320 1250 1252 29 5 55410.894 55410.935 22975 22977 1907 1909 16 1.13 Downlink Earth Point No changes from the Data Characteristics Handbook. 1.14 Manually Excluded Cadences No changes from the Data Characteristics Handbook. 1.15 Incomplete Apertures Give Flux and Feature Discontinuities at Quarter Boundaries No changes from the Data Characteristics Handbook. 16 of 25 KSCI-19049-001: Kepler Data Release 9 Notes 1.16 Argabrightening Table 5: Q6 LC Argabrightening Events with amplitude TMAD > 10, and occurring on a number of channels TMCE > 10. The columns are (1) CIN = Cadence Interval Number for Argabrightening cadences, (2) RCI = relative cadence index for Argabrightening cadences, (3) Date = Arg cadence mid-Times, MJD, (4) Mean Argabrightening statistic over Channels of Arg Event <S Arg>FPA (5) N_chan = Channels exceeding threshold in Arg cadence, (6) N_pipe = Channels exceeding default (pipeline) threshold in Arg cadence. MAD is calculated on a channel-by-channel basis. CIN 21601 21724 21836 22014 22169 22296 23130 23465 23466 23616 23944 23945 23946 23948 24061 24386 24427 24470 24640 24796 24994 25111 25334 17 of 25 RCI 533 656 768 946 1101 1228 2062 2397 2398 2548 2876 2877 2878 2880 2993 3318 3359 3402 3572 3728 3926 4043 4266 Mid-Times(MJD) <SArg> N_chan 55382.81801 55385.33134 55387.61990 55391.25708 55394.42429 55397.01936 55414.06099 55420.90624 55420.92668 55423.99172 55430.69394 55430.71437 55430.73481 55430.77567 55433.08465 55439.72557 55440.56335 55441.44199 55444.91570 55448.10335 55452.14920 55454.53993 55459.09662 17.4 7.2 7.6 8.5 8.2 7.8 8.3 62.4 15.4 100.0 4.9 7.4 10.5 18.9 14.0 7.8 36.9 66.3 6.8 3.3 7.4 10.0 18.2 68 18 19 26 23 21 27 69 27 80 11 18 30 59 56 16 79 80 22 13 12 34 67 0 0 0 0 0 0 0 13 1 36 0 0 0 0 0 0 0 13 0 0 0 0 0 N_pipe KSCI-19049-001: Kepler Data Release 9 Notes Table 6: Q6 SC Argabrightening Events with amplitude TMAD > 10, and occurring on a number of channels TMCE > 10. The columns have the same meanings as Table 5: Q6 LC Argabrightening Events with amplitude TMAD > 10, and occurring on a number of channels TMCE > 10. The columns are (1) CIN = Cadence Interval Number for Argabrightening cadences, (2) RCI = relative cadence index for Argabrightening cadences, (3) Date = Arg cadence mid-Times, MJD, (4) Mean Argabrightening statistic over Channels of Arg Event <S Arg>FPA (5) N_chan = Channels exceeding threshold in Arg cadence, (6) N_pipe = Channels exceeding default (pipeline) threshold in Arg cadence. MAD is calculated on a channel-by-channel basis. Note consecutive detections of the largest events. A horizontal line separates the 3 Months of the Quarter. The relative cadence index (RCI) is reset at the start of each Month. CIN RCI Mid-Times(MJD) <SArg> N_chan 636501 640187 648880 665777 15972 19658 28351 4238 55382.81562 55385.32623 55391.24721 55402.75609 17.6 8.4 9.3 7.1 69 23 30 15 0 0 0 0 692439 692440 696948 696949 30900 30901 35409 35410 55420.91612 55420.91680 55423.98729 55423.98797 71.1 15.7 44.0 66.0 66 22 76 69 42 6 16 37 710291 720044 721281 722571 722572 722573 727678 748502 2042 11795 13032 14322 14323 14324 19429 40253 55433.07545 55439.71842 55440.56096 55441.43961 55441.44029 55441.44097 55444.91809 55459.10173 8.3 6.0 33.8 12.7 17.2 29.3 6.3 9.7 21 12 77 43 56 73 20 32 0 2 3 0 1 4 0 0 18 of 25 N_pipe KSCI-19049-001: Kepler Data Release 9 Notes 1.17 Background Time Series Figure 6: Background time series for Q6 showing the average over all the modules, and the modules furthest from (2.4) and nearest to (24.4) the Galactic plane. The narrow spikes are Argabrightening events. 1.18 Pixel Sensitivity Dropouts No changes from the Data Characteristics Handbook. 1.19 Short Cadence Requantization Gaps No changes from the Data Characteristics Handbook. 1.20 Spurious Frequencies in SC Data No changes from the Data Characteristics Handbook. 19 of 25 KSCI-19049-001: Kepler Data Release 9 Notes 1.21 Anomaly Summary Table Machine readable CINs for the anomalies below are in the Data Supplement. Table 7: Anomaly Summary Table for Long and Short Cadences LC CIN Start 21069 22395 23949 23465 23616 24470 End 21069 22436 23992 23466 23616 24470 Anomaly Type EARTH_POINT EARTH_POINT EARTH_POINT ARGABRIGHTENING ARGABRIGHTENING ARGABRIGHTENING SC CIN Start 622969 End 622980 Anomaly Type COARSE POINT 627349 631729 636109 640489 644869 649249 653629 658009 660259 664609 668989 673369 677749 682129 686509 690889 695269 696949 699649 704029 706879 692439 696948 711259 627360 631740 636120 640500 644880 649260 653640 658020 660270 664620 669000 673380 677760 682140 686520 690900 695280 696949 699660 704040 706890 692440 696949 711270 COARSE POINT COARSE POINT COARSE POINT COARSE POINT COARSE POINT COARSE POINT COARSE POINT COARSE POINT COARSE POINT COARSE POINT COARSE POINT COARSE POINT COARSE POINT COARSE POINT COARSE POINT COARSE POINT COARSE POINT COARSE POINT COARSE POINT COARSE POINT COARSE POINT ARGABRIGHTENING ARGABRIGHTENING COARSE POINT 715639 720019 724399 728779 733129 737509 741889 715650 720030 724410 728790 733140 737520 741900 COARSE COARSE COARSE COARSE COARSE COARSE COARSE 20 of 25 POINT POINT POINT POINT POINT POINT POINT Note Monthly science data downlink Monthly science data downlink Monthly science data downlink See Section 1.16. Note See Section 1.11 for Momentum desaturations. See Section 1.16 See Section 1.11 for Momentum desaturations. KSCI-19049-001: Kepler Data Release 9 Notes 746269 750649 750970 752419 21 of 25 746280 750660 751029 752430 COARSE COARSE COARSE COARSE POINT POINT POINT POINT KSCI-19049-001: Kepler Data Release 9 Notes Time and Time Stamps No changes from the Data Characteristics Handbook. 22 of 25 KSCI-19049-001: Kepler Data Release 9 Notes Contents of Supplement The Supplement is available as a full package (DataReleaseNotes_09_SupplementFull.tar), which contains the files described below. Pipeline Instance Detail Reports Q6_LC_r6.2_ksop652_PA_+PDC_with_mpe_asrun_Pipeline_Instance_Detail_Report_110104.txt Q6_SCM1_r6.2_ksop652_with_mpe_as-run_Pipeline_Instance_Detail_Report_110104.txt Q6_SCM2_r6.2_ksop652_with_mpe_as-run_Pipeline_Instance_Detail_Report_110104.txt Q6_SCM3_r6.2_ksop652_with_mpe_as-run_Pipeline_Instance_Detail_Report_110104.txt Data Anomaly Types DataAnomalyTypes_Q6_LC_PID3197_Summary.txt DataAnomalyTypes_Q6M1_SC_PID3217_Summary.txt DataAnomalyTypes_Q6M2_SC_PID3237_Summary.txt DataAnomalyTypes_Q6M3_SC_PID3277_Summary.txt Mod.out Central Motion Q6_central_row_motion.txt Q6_central_column_motion.txt Average LDE board Temperature Q6_LDE_averageBoardTemp.txt Q6_TH12LVAT_MJD_gap.txt Q6_TH1RW34T_MJD_gap.txt Background Time Series Q6_SCM1_background.txt Q6_SCM2_background.txt Q6_SCM3_background.txt Q6_LC_background.txt Flight System Events Argabrightening Detections ArgAgg_Q6_LC_PID3197_MADT010_MCT10_Summary.txt ArgAgg_Q6M1_SC_PID3557_MADT010_MCT10_Summary.txt ArgAgg_Q6M2_SC_PID3577_MADT010_MCT10_Summary.txt ArgAgg_Q6M3_SC_PID3597_MADT010_MCT10_Summary.txt 23 of 25 KSCI-19049-001: Kepler Data Release 9 Notes Out of Fine Point Cadence Lists Q6M1_SC_isNotFinePoint.txt Q6M2_SC_isNotFinePoint.txt Q6M3_SC_isNotFinePoint.txt Q6_LC_isNotFinePoint.txt Zero Crossing Events Q6_Dec21_SC_ZeroCrossings.txt Q6_Dec21_LC_ZeroCrossings.txt Short Supplement Package The Supplement also contains a short package suitable for emailing (DataReleaseNotes_09_SupplementSmall.tar). The small package does not contain the following files: 13Dec_SC_Q6M1_background.txt 13Dec_SC_Q6M2_background.txt 13Dec_SC_Q6M3_background.txt Dec13_LC_Q6_background.txt 13Dec_Q6_LC_central_row_motion.txt 13Dec_Q6_LC_central_column_motion.txt Q6_TH12LVAT_MJD_gap.txt Q6_TH1RW34T_MJD_gap.txt 24 of 25 KSCI-19049-001: Kepler Data Release 9 Notes References No changes from Data Characteristics Handbook. 25 of 25

