Schils assignment 1
advertisement
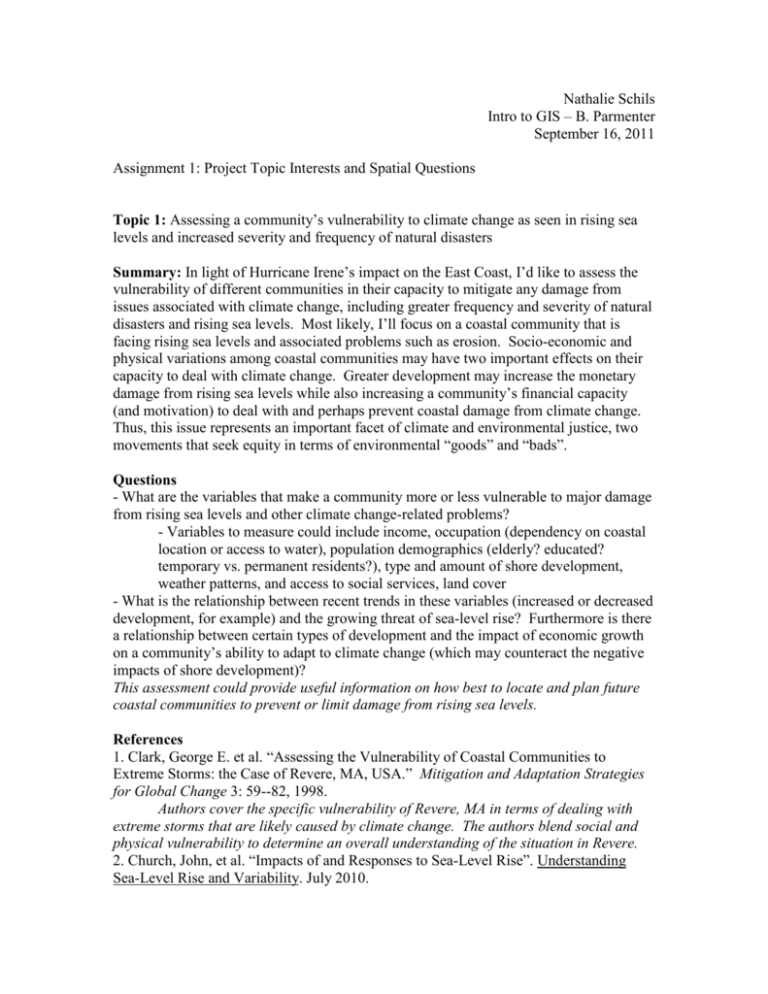
Nathalie Schils Intro to GIS – B. Parmenter September 16, 2011 Assignment 1: Project Topic Interests and Spatial Questions Topic 1: Assessing a community’s vulnerability to climate change as seen in rising sea levels and increased severity and frequency of natural disasters Summary: In light of Hurricane Irene’s impact on the East Coast, I’d like to assess the vulnerability of different communities in their capacity to mitigate any damage from issues associated with climate change, including greater frequency and severity of natural disasters and rising sea levels. Most likely, I’ll focus on a coastal community that is facing rising sea levels and associated problems such as erosion. Socio-economic and physical variations among coastal communities may have two important effects on their capacity to deal with climate change. Greater development may increase the monetary damage from rising sea levels while also increasing a community’s financial capacity (and motivation) to deal with and perhaps prevent coastal damage from climate change. Thus, this issue represents an important facet of climate and environmental justice, two movements that seek equity in terms of environmental “goods” and “bads”. Questions - What are the variables that make a community more or less vulnerable to major damage from rising sea levels and other climate change-related problems? - Variables to measure could include income, occupation (dependency on coastal location or access to water), population demographics (elderly? educated? temporary vs. permanent residents?), type and amount of shore development, weather patterns, and access to social services, land cover - What is the relationship between recent trends in these variables (increased or decreased development, for example) and the growing threat of sea-level rise? Furthermore is there a relationship between certain types of development and the impact of economic growth on a community’s ability to adapt to climate change (which may counteract the negative impacts of shore development)? This assessment could provide useful information on how best to locate and plan future coastal communities to prevent or limit damage from rising sea levels. References 1. Clark, George E. et al. “Assessing the Vulnerability of Coastal Communities to Extreme Storms: the Case of Revere, MA, USA.” Mitigation and Adaptation Strategies for Global Change 3: 59--82, 1998. Authors cover the specific vulnerability of Revere, MA in terms of dealing with extreme storms that are likely caused by climate change. The authors blend social and physical vulnerability to determine an overall understanding of the situation in Revere. 2. Church, John, et al. “Impacts of and Responses to Sea-Level Rise”. Understanding Sea-Level Rise and Variability. July 2010. This articles analyses the methods for studying sea-level-rise impacts with sections highlighting the recent and future impacts of sea-level rise. The conclusion provides steps for responding to sea-level rise. 3. Rygel, Lisa, et. al. “A Method for Constructing a Social Vulnerability Index: An Application to Hurriance Storm Surges in a Developed Country.” Mitigation and Adaptation Strategies for Global Change 11: 741-764, 2006. Demonstrates how to build an understanding of social vulnerability, especially as it relates to dealing with storm surges from major weather events. It could be helpful in connecting my research on the vulnerability of East Coast communities to storms like Hurricane Irene. Data sources http://woodshole.er.usgs.gov/project-pages/cvi/ Data focuses on the physical phenomenon of vulnerability to sea level rise. http://esp.cr.usgs.gov/info/clues and http://www.nrcs.usda.gov/wps/portal/nrcs/home Free data on land use and environmental sensitivity in the United States. http://landcover.usgs.gov/landcoverdata.php#na Free database focusing on coastal areas and patterns of land use change. http://www.gisclimatechange.org/ Free data on climate change scenarios with information on temperature and precipitation. Topic 2: Childhood obesity and access to athletic organizations, clubs, and classes Summary: According to the CDC, no state had a prevalence of obesity less than 20% in 2010 and many states had rates of 30% or higher. Childhood obesity has become an alarming trend in the United States with over 15% of all children and adolescents affected, a threefold increase from twenty years ago. I’m interested in looking at the prevalence of childhood obesity in the Boston area and determining if a relationship exists between access to athletic activity (physical education classes, after-school sports, gyms and public courts/field) and obesity rates. This is especially crucial given the major cuts seen in funding for public community-based recreational opportunities for children such as sports leagues and open-access parks and fields. Questions - What is the relationship between access to athletic activity opportunities (measured in terms of proximity to parks, support of physical education and after school sports programs) and childhood obesity? How does access incentivize activity in children and adolescents? - Are children of certain socio-economic levels more vulnerable (do they already exhibit less healthy eating habits and greater exposure to other health-impairing - toxins) to cuts in physical education programs that could undermine their overall health and well-being? How effective have community-based campaigns been in promoting a more active lifestyle and reducing childhood obesity? These questions (and their answers) could support reinstating or increasing funding for physical education and after school sports programs and could help identify the most effective ways to increase physical activity in children and adolescents and combat childhood obesity. References 1. Maroko, A.R., Maantay, J.A., Sohler, N.L., Grady, K.L., Arno, P.S. 2009. The complexities of measuring access to parks and physical activity sites in New York City: A quantitative and qualitative approach. International Journal of Health Geographics, 8 (1), art. no. 34 This analysis reveals many of the challenges of using GIS to study access to parks, such as the pitfalls of the “container” approach, but also provides good background information on layering parks data with demographic data and analyzing for significant relationships. 2. Design for Health - http://www.designforhealth.net/index.html This project (and the associated website) provides a lot of useful information on the relationships between city planning and public health, especially as it relates to eating habits and physical activity. The project also references studies that focus on the relationship between one’s environment (access to athletics facilities, safety of community, transportation use, food choices) and one’s level of physical activity. 3. Koepp, Joel, Forsyth, Ann, and Zimmerman, Jason. “Mapping Park Buffers: The Minnesota Method”. Metropolitan Design Center. November 2005. This paper focuses on the different methods for determining access to parks which can better demonstrate “true” levels of access. Using the street network buffer method will be important as I analyze the relationship between accessibility and childhood obesity. Data sources http://www.cdc.gov/nchs/data/hestat/obesity_child_07_08/obesity_child_07_08.pdf National trends of the prevalence of childhood obesity. http://apps.nccd.cdc.gov/DDT_STRS2/CountyPrevalenceData.aspx?mode=OBS http://apps.nccd.cdc.gov/DDT_STRS2/CountyPrevalenceData.aspx?mode=PHY State and county specific data on obesity and physical activity levels. http://www.healthindicators.gov/Indicators/Initiative_Healthy-People-2020_4/Selection Lots of data on hundreds of different indicators for human health, including access to school facilities, amount of physical activity, etc.


