Feedback Sheet - Sustainable Jersey
advertisement
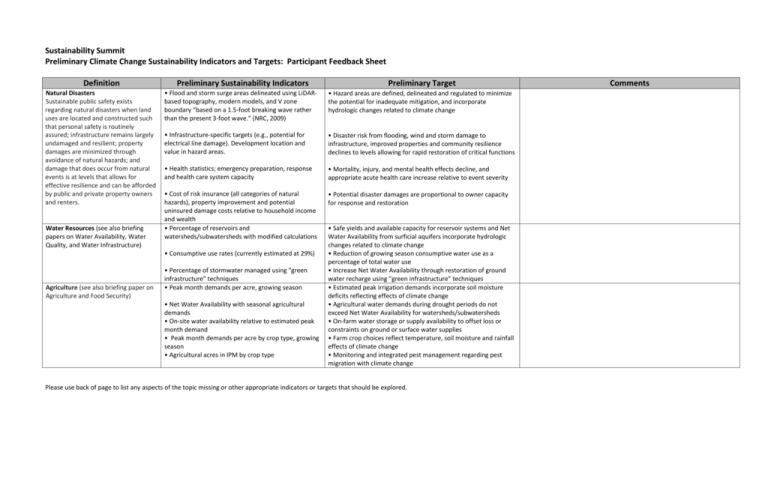
Sustainability Summit Preliminary Climate Change Sustainability Indicators and Targets: Participant Feedback Sheet Definition Natural Disasters Sustainable public safety exists regarding natural disasters when land uses are located and constructed such that personal safety is routinely assured; infrastructure remains largely undamaged and resilient; property damages are minimized through avoidance of natural hazards; and damage that does occur from natural events is at levels that allows for effective resilience and can be afforded by public and private property owners and renters. Water Resources (see also briefing papers on Water Availability, Water Quality, and Water Infrastructure) Preliminary Sustainability Indicators • Hazard areas are defined, delineated and regulated to minimize the potential for inadequate mitigation, and incorporate hydrologic changes related to climate change • Infrastructure-specific targets (e.g., potential for electrical line damage). Development location and value in hazard areas. • Disaster risk from flooding, wind and storm damage to infrastructure, improved properties and community resilience declines to levels allowing for rapid restoration of critical functions • Health statistics; emergency preparation, response and health care system capacity • Mortality, injury, and mental health effects decline, and appropriate acute health care increase relative to event severity • Cost of risk insurance (all categories of natural hazards), property improvement and potential uninsured damage costs relative to household income and wealth • Percentage of reservoirs and watersheds/subwatersheds with modified calculations • Potential disaster damages are proportional to owner capacity for response and restoration • Consumptive use rates (currently estimated at 29%) Agriculture (see also briefing paper on Agriculture and Food Security) Preliminary Target • Flood and storm surge areas delineated using LiDAR based topography, modern models, and V zone boundary “based on a 1.5-foot breaking wave rather than the present 3-foot wave.” (NRC, 2009) • Percentage of stormwater managed using “green infrastructure” techniques • Peak month demands per acre, growing season • Net Water Availability with seasonal agricultural demands • On-site water availability relative to estimated peak month demand • Peak month demands per acre by crop type, growing season • Agricultural acres in IPM by crop type • Safe yields and available capacity for reservoir systems and Net Water Availability from surficial aquifers incorporate hydrologic changes related to climate change • Reduction of growing season consumptive water use as a percentage of total water use • Increase Net Water Availability through restoration of ground water recharge using “green infrastructure” techniques • Estimated peak irrigation demands incorporate soil moisture deficits reflecting effects of climate change • Agricultural water demands during drought periods do not exceed Net Water Availability for watersheds/subwatersheds • On-farm water storage or supply availability to offset loss or constraints on ground or surface water supplies • Farm crop choices reflect temperature, soil moisture and rainfall effects of climate change • Monitoring and integrated pest management regarding pest migration with climate change Please use back of page to list any aspects of the topic missing or other appropriate indicators or targets that should be explored. Comments


