4. Methods of Analysis - Mill Creek Watershed Partnership
advertisement

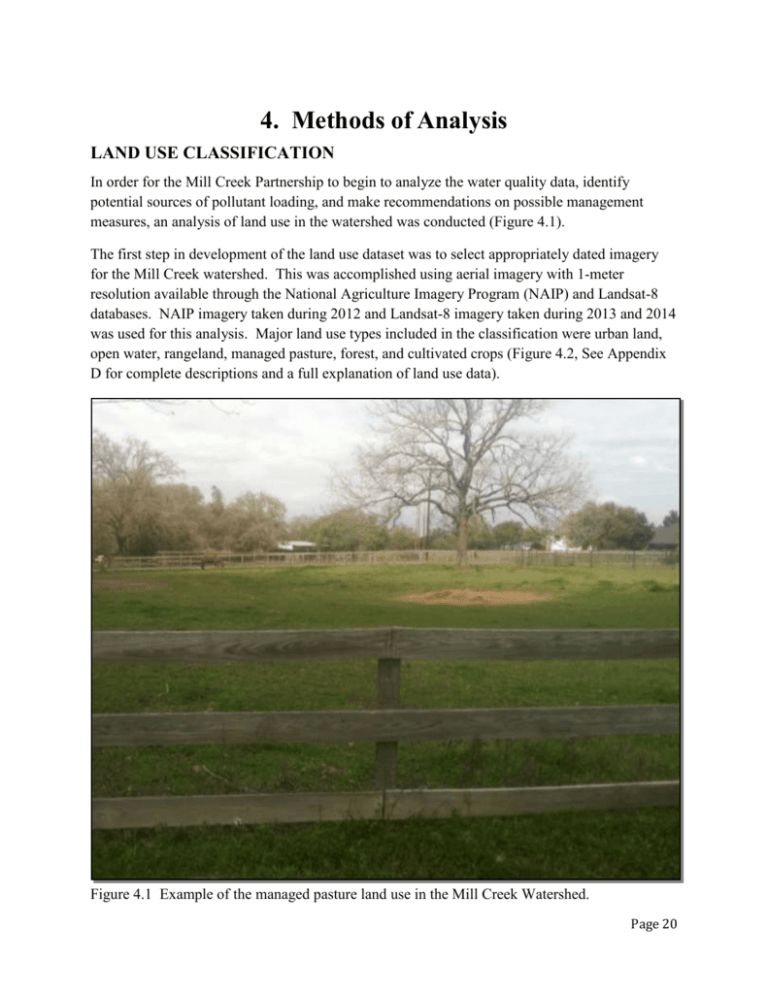
4. Methods of Analysis LAND USE CLASSIFICATION In order for the Mill Creek Partnership to begin to analyze the water quality data, identify potential sources of pollutant loading, and make recommendations on possible management measures, an analysis of land use in the watershed was conducted (Figure 4.1). The first step in development of the land use dataset was to select appropriately dated imagery for the Mill Creek watershed. This was accomplished using aerial imagery with 1-meter resolution available through the National Agriculture Imagery Program (NAIP) and Landsat-8 databases. NAIP imagery taken during 2012 and Landsat-8 imagery taken during 2013 and 2014 was used for this analysis. Major land use types included in the classification were urban land, open water, rangeland, managed pasture, forest, and cultivated crops (Figure 4.2, See Appendix D for complete descriptions and a full explanation of land use data). Figure 4.1 Example of the managed pasture land use in the Mill Creek Watershed. Page 20 Methods of Analysis Figure 4.2. Mill Creek Watershed land use map. Land parcels were assigned to classes based on attributes including vegetation, hydrology, and level of urban development. In order to simplify the map, similar land uses were aggregated where appropriate. For example, the urban land use category includes five subcategory land uses: open, low, medium, and high intensity urban development and barren land (Table 4.1). The watershed is made up of 55% rangeland, 21% managed pasture, 15% forest, 8% urban, and 1% cropland areas. Table 4.1. Summary of land uses in the Mill Creek Watershed. Land Use Percentage of Total Acres Rangeland 54.7 144,004 Managed pasture 20.6 54,323 Forest 15.2 40,021 Urban 7.9 20,667 Cultivated crops 1.1 3,025 Open water 0.5 1,400 Total 100.0 263,450 Page 21 Methods of Analysis Subwatershed Delineation To enable closer examination of potential pollutant sources and as a tool to assist in focusing implementation efforts, the watershed was divided into 10 subwatersheds based upon elevation and hydrological characteristics (Figure 4.3). Figure 4.3. Subwatersheds of the Mill Creek Watershed. Page 22 Methods of Analysis DETERMINING SOURCES OF POLLUTION Load Duration Curve A widely accepted approach for analyzing water quality data is the use of a Load Duration Curve (LDC). An LDC allows for a visual determination of pollutant loadings under different flow conditions. The first step in developing an LDC is construction of a Flow Duration Curve. Flow data for a particular sampling location are sorted in order and then ranked from highest to lowest to determine the frequency of a particular flow in the stream. These results are used to create a graph of flow volume versus frequency which produces the flow duration curve (Figure 4.4). Developing a Load Duration Curve There is a single stream flow gage (USGS 08111700) in the Mill Creek Watershed. The gage is located at SH-36 and Mill Creek. As previously noted, this is the same location at which TCEQ collects water quality data. Although stream flow data collection on Mill Creek began in 1940, it was not until 1963 that stream flow data were recorded on a daily basis. However, since reliable water quality data were not collected on Mill Creek prior to 1974 only stream flow data from that point forward were used to develop the flow duration curve. Example Flow Duration Curve 1.E+04 (cfs) Flowrate Flowrate (cfs) 1.E+03 1.E+02 1.E+01 1.E+00 0 1.E-01 10 20 30 40 50 60 70 80 90 100 Percentof of Days Days Flow Percent FlowExceeded Exceeded Figure 4.4. Example flow duration curve. Historical stream flow data are used to determine how frequently stream conditions exceed different flows. Page 23 Methods of Analysis Next, data from the flow duration curve are multiplied by the concentration of the water quality criterion for the pollutant to produce the LDC (Fig. 4.5). This curve shows the maximum pollutant load (amount per unit time; e.g., for bacteria, cfu/day) a stream can assimilate across the range of flow conditions (low flow to high flow) without exceeding the water quality standard. Flow regimes typically are identified as areas of the LDC where the slope of the curve changes. In this example, as in the actual LDCs for Mill Creek, there are three flow regimes: high flows (0-10), mid-range (11-60), and low flows (61-100). Example Load Duration Curve 1.E+17 Maximum Allowable E. coli Load with 10% MOS 1.E+16 E. coli Load (CFU/day) 1.E+15 Load Regression Curve 1.E+14 1.E+13 High Flows 1.E+12 1.E+11 Mid-Range 1.E+10 1.E+09 Low Flows 1.E+08 0 10 20 30 40 50 60 70 80 90 100 Percent of Days Load Exceeded Figure 4.5. Example load duration curve. Multiplying stream flow by pollutant concentration produces an estimate of pollutant load. Stream monitoring data for a pollutant then can be plotted on the curve to show the frequency and magnitude of exceedances. In the example in Figure 4.5, the red line indicates the maximum acceptable stream load for E. coli bacteria, and the squares, diamonds, triangles, x-bars, and circles represent water quality monitoring data collected under high, moist conditions, midrange, dry, and low flow conditions, respectively. Where the monitoring samples are above the red line, the actual stream load has exceeded the water quality standard. Points located on or below the red line are in compliance with the water quality standard. In order to analyze the entire range of monitoring data, regression analysis is conducted using the monitored samples to calculate the “line of best fit” (blue line). In Figure 4.6, where the blue Page 24 Methods of Analysis line is on or below the red line, monitoring data at that flow percentile are in compliance with the water quality standard. Where the blue line is above the red line, monitoring data indicate that the water quality standard is not being met at that flow percentile. Regression analysis also enables calculation of the estimated percent reduction needed to achieve acceptable pollutant loads. In this example, load reductions of 3, 24, and 18% are needed at high, mid-range and low flows, respectively. Example Load Duration Curve 1.E+17 Maximum Allowable E. coli Load with 10% MOS 1.E+16 E. coli Load (CFU/day) 1.E+15 Load Regression Curve 1.E+14 1.E+13 High Flows 1.E+12 1.E+11 Mid-Range 1.E+10 1.E+09 Low Flows 1.E+08 0 10 20 30 40 50 60 70 80 90 100 Percent of Days Load Exceeded Figure 4.6. Example load duration curve with monitored samples and calculated “line of best fit.” Typically, a margin of safety (MOS) is applied to the threshold pollutant concentration to account for possible variations in loading due to sources, stream flow, effectiveness of management measures, and other sources of uncertainty. The Steering Committee selected a 10% MOS for bacteria in this plan. As previously discussed in Chapter 1, the geometric mean of E. coli must be below 126 cfu/100 mL to avoid being listed as an impaired waterbody. Thus, threshold concentrations used in the LDC analysis were 113 cfu/100 mL [126 – (126 x 0.1)] for bacteria, as approved by the Steering Committee. By considering the processes at work during high, mid-range, and low flows, it is possible to link pollutant concentrations with potential point or nonpoint sources of pollution. In general, if exceedances observed on the LDC only occur during high flows, nonpoint sources are Page 25 Methods of Analysis considered to be the primary causes of impairment. This is because high flows are typically associated with higher rainfall events that generate surface runoff which can carry pollutants to the stream. In contrast, exceedances at low flows are generally attributed to point sources since no runoff is entering the stream and only direct discharges or deposition into the stream are contributing (see Appendix E for a more detailed explanation of Load Duration Curve). Spatially Explicit Load Enrichment Calculation Tool To estimate the likely distribution of potential pollutant sources across the watershed and the degree of contribution by each, the Mill Creek Steering Committee utilized the Spatially Explicit Load Enrichment Calculation Tool (SELECT) developed by the Spatial Sciences Laboratory and the Biological and Agricultural Engineering Department at Texas A&M University. Each potential pollutant source identified by the Steering Committee was distributed across the 10 subwatersheds based on the best available data and information regarding its presence in a given subwatershed. Geographical distributions and pollutant loads were estimated for each source in each subwatershed based on known pollutant production rates. By so doing, areas and sources with the greatest potential for impacting water quality were identified and targeted for implementation. A more complete explanation of the SELECT approach can be found in Appendix F. It is important to note that SELECT evaluates the potential for pollution from the possible sources and subwatersheds, resulting in a relative approximation for each area. Sources with high loading potential are then evaluated to determine if necessary controls are already in place or if action should be taken to reduce pollutant contributions. Data Limitations When determining the relationships between instream conditions and factors in the surrounding landscape, it is important to consider all potential sources of pollution and rely on the most dependable and current data available. In addition to receiving input from local stakeholders, information used in the analysis of the Mill Creek Watershed was gathered from a number of sources, including local and regional groups, river authorities, and county, state and federal agencies. It also is important to remember that information collected for the development of the Mill Creek WPP represents a snapshot in time of a host of complex processes at work. Whether associated with human activities and urban growth, weather patterns, animal distributions, or other factors, the Mill Creek watershed is very dynamic in nature, and conditions can change dramatically between years and even within a given season. Furthermore, time lags often exist between population census counts and remapping and updating of land cover and land information use. As a result, contributions from individual pollutant sources may vary considerably over time. Page 26 Methods of Analysis Estimate of Pollutant Loads and Required Reductions The SH-36 site has served as the only routine monitoring station in the Mill Creek Watershed and is utilized by TCEQ for the 305(b) assessment of Mill Creek. Sampling began at the SH-36 location in 1974, thus the site has over 40 years of data. The site also represents approximately 91% of the total area of the watershed, with a drainage area of 376 square miles. For these reasons, the SH-36 sampling station was used to determine load reduction goals for the watershed. BACTERIA LOADS LDC analysis for the SH-36 monitoring site indicates the bacteria water quality standard is not supported above mid-range flows, while it is supported under dry conditions and low flows (Fig 4.7). Based on the regression analysis, reductions in E. coli loads of 92, 62, and 12% will be required at high, moist conditions, and mid-range flows, respectively, to achieve the water quality criterion for primary contact recreation. 1.E+17 Maximum Allowable E. coli Load with 10% MOS 1.E+16 E. coli Load (CFU/day) 1.E+15 Load Regression Curve 1.E+14 1.E+13 High Flows 1.E+12 1.E+11 Mid-Range 1.E+10 1.E+09 Low Flows 92% 1.E+08 0 10 0% 42% 20 30 40 50 60 70 80 90 100 Percent of Days Load Exceeded Figure 4.7. Load duration curve for E. coli at the SH-36 monitoring station. Page 27 Methods of Analysis RECOMMENDED PERCENT LOAD REDUCTION Based on the LDC analysis, the Steering Committee made the decision to use a load reduction goal of 42% as identified for mid-range conditions. This represents a very conservative approach which will guide implementation efforts to not only achieve current water quality goals, but also will help to protect Mill Creek into the future by considering increasing pressure on the watershed anticipated due to long-term population growth. This load reduction was applied across the entire watershed for all sources and all flow regimes. ANNUAL LOADS AND LOAD REDUCTIONS Based on the LDC analysis, mean annual loads, load reductions, and target loads for bacteria (cfu/year) were calculated utilizing data from the SH-36 monitoring station (Table 4.2). Calculations for bacteria were based on loading occurring between the 11th and 60th percentile flows, which is the range of flows for which the effective implementation of management measures is considered to be feasible. Table 4.2. Mean annual loads, load reductions and target loads for the SH-36 monitoring station. Pollutant Mean Annual Mean Annual Mean Annual Reduction Load Load Reduction Target Load Goal (%) E. coli 4.99 x 10¹⁴ 2.10 x 10¹⁴ 2.89 x 10¹⁴ 42 (cfu/year) HOW VARIABLE FLOWS INFLUENCE TRENDS IN BACTERIA LOADS Table 4.3 is a summary of the estimated annual average bacteria load categorized by flow condition for the SH-36 monitoring station. Nonsupport of the primary contact recreation use during mid-range and high flows is indicative of contributions from nonpoint sources. High flow events occur in response to high rainfall runoff which transports pollutants greater distances across the landscape. However, these events occur only 10% of the time, and generally the runoff resulting from these extreme rainfall events cannot effectively be controlled by available best management practices (BMPs). In contrast, runoff events which result in mid-range and moist conditions stream flows are more common and considered more manageable using available BMPs. On that basis, the focus of implementation will be on management of loading that occurs during the mid-range and moist conditions flow ranges (11-60th percentile flows). Bacteria loading at low and mid-low flows are not of sufficient magnitude to cause nonattainment of the water quality standard for primary contact recreation (Figure 4.8). Page 28 Methods of Analysis Table 4.3. Estimated average annual E. coli loads under different flow conditions in Mill Creek based on water quality data at the SH-36 monitoring station. Loading by Streamflow Condition (cfu/yr) Monitoring Station High Flows Mid-range Flows Low Flows Mill Creek at SH-36 5.45 x 10¹⁵ 4.00 x 10¹¹ 1.07 x 10¹⁰ Figure 4.8. Contact recreation in Mill Creek. Photo courtesy of XXXX. Page 29


