Motion Graphs Worksheet: Physics Problems & Solutions
Unit 1A Motion Graphs CW 01
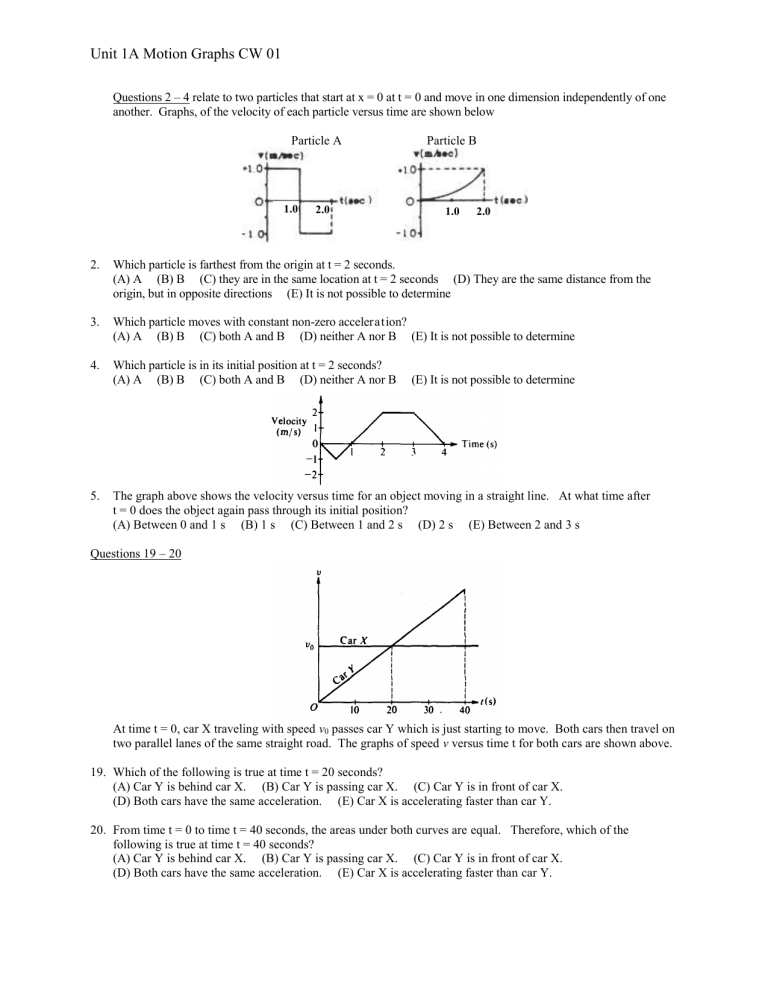
Questions 2 – 4 relate to two particles that start at x = 0 at t = 0 and move in one dimension independently of one another. Graphs, of the velocity of each particle versus time are shown below
Particle A Particle B
1.0 2.0 1.0 2.0
2. Which particle is farthest from the origin at t = 2 seconds.
(A) A (B) B (C) they are in the same location at t = 2 seconds (D) They are the same distance from the origin, but in opposite directions (E) It is not possible to determine
3. Which particle moves with constant non-zero acceleration?
(A) A (B) B (C) both A and B (D) neither A nor B (E) It is not possible to determine
4. Which particle is in its initial position at t = 2 seconds?
(A) A (B) B (C) both A and B (D) neither A nor B (E) It is not possible to determine
5. The graph above shows the velocity versus time for an object moving in a straight line. At what time after t = 0 does the object again pass through its initial position?
(A) Between 0 and 1 s (B) 1 s (C) Between 1 and 2 s (D) 2 s (E) Between 2 and 3 s
Questions 19 – 20
At time t = 0, car X traveling with speed v
0
passes car Y which is just starting to move. Both cars then travel on two parallel lanes of the same straight road. The graphs of speed v versus time t for both cars are shown above.
19. Which of the following is true at time t = 20 seconds?
(A) Car Y is behind car X. (B) Car Y is passing car X. (C) Car Y is in front of car X.
(D) Both cars have the same acceleration. (E) Car X is accelerating faster than car Y.
20. From time t = 0 to time t = 40 seconds, the areas under both curves are equal. Therefore, which of the following is true at time t = 40 seconds?
(A) Car Y is behind car X. (B) Car Y is passing car X. (C) Car Y is in front of car X.
(D) Both cars have the same acceleration. (E) Car X is accelerating faster than car Y.
Unit 1A Motion Graphs CW 01
21. Which of the following pairs of graphs shows the distance traveled versus time and the speed versus time for an object uniformly accelerated from rest?
Distance
(A) o
(D)
Distance
Speed t o
Speed
(B)
Distance t o
Distance
(E)
Speed t o
Speed t
Distance
(C) o
Speed t o t o t o t o t o t
34. The graph above shows the velocity v as a function of time t for an object moving in a straight line. Which of the following graphs shows the corresponding displacement x as a function of time t for the same time interval?
43. The graph above is a plot of position versus time. For which labeled region is the velocity positive and the acceleration negative?
(A) A (B) B (C) C (D) D (E) E
44. A child left her home and started walking at a constant velocity. After a time she stopped for a while and then continued on with a velocity greater than she originally had. All of a sudden she turned around and walked very quickly back home. Which of the following graphs best represents the distance versus time graph for her walk?
(A) (B) (C) (D) (E)


