Name: Locating an Earthquake Epicenter OBJECTIVES Identify P, S
advertisement
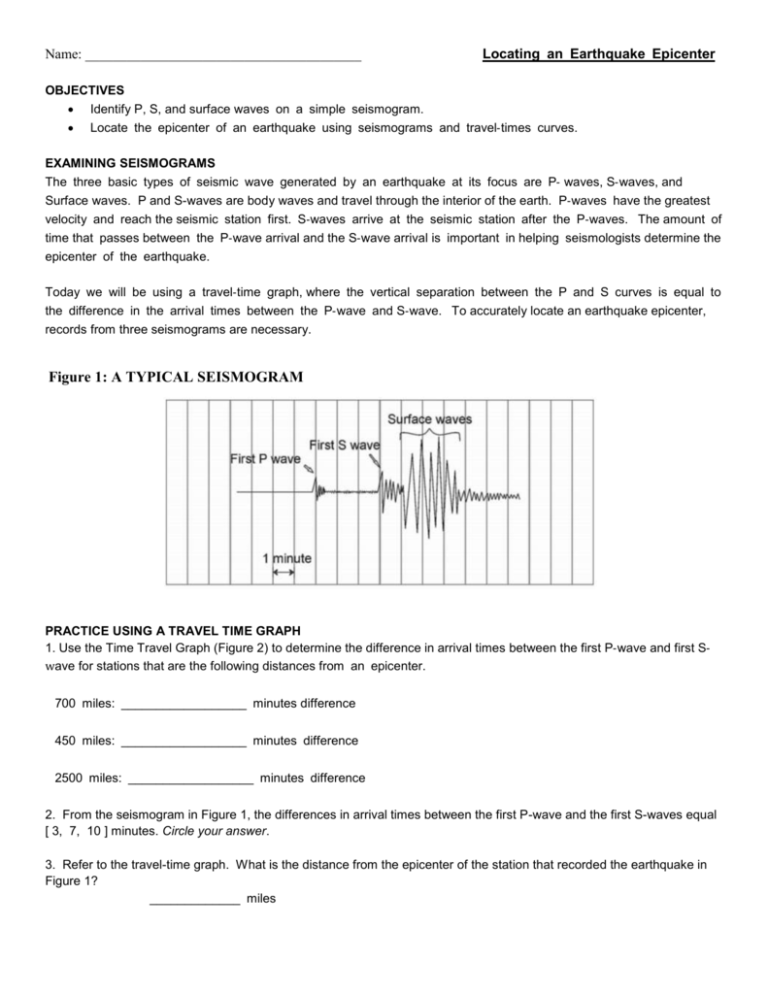
Name: ________________________________________ Locating an Earthquake Epicenter OBJECTIVES Identify P, S, and surface waves on a simple seismogram. Locate the epicenter of an earthquake using seismograms and travel‐times curves. EXAMINING SEISMOGRAMS The three basic types of seismic wave generated by an earthquake at its focus are P‐ waves, S‐waves, and Surface waves. P and S-waves are body waves and travel through the interior of the earth. P‐waves have the greatest velocity and reach the seismic station first. S‐waves arrive at the seismic station after the P‐waves. The amount of time that passes between the P‐wave arrival and the S‐wave arrival is important in helping seismologists determine the epicenter of the earthquake. Today we will be using a travel‐time graph, where the vertical separation between the P and S curves is equal to the difference in the arrival times between the P‐wave and S‐wave. To accurately locate an earthquake epicenter, records from three seismograms are necessary. Figure 1: A TYPICAL SEISMOGRAM PRACTICE USING A TRAVEL TIME GRAPH 1. Use the Time Travel Graph (Figure 2) to determine the difference in arrival times between the first P‐wave and first S‐ wave for stations that are the following distances from an epicenter. 700 miles: __________________ minutes difference 450 miles: __________________ minutes difference 2500 miles: __________________ minutes difference 2. From the seismogram in Figure 1, the differences in arrival times between the first P-wave and the first S-waves equal [ 3, 7, 10 ] minutes. Circle your answer. 3. Refer to the travel-time graph. What is the distance from the epicenter of the station that recorded the earthquake in Figure 1? _____________ miles DETERMINING AN EARTHQUAKE EPICENTER: Figure 3 illustrates seismograms from the same earthquake recorded at St. Louis, MO, Houston, TX and Los Angeles, CA. Use this information to complete the following steps. 1. First determine the difference in arrival times between the P and S waves. Then use the Travel-Time Graph (figure 2) to determine the distance that each given station is from the epicenter. Write your answers in the Epicenter Data Table. 2. After you have determined the distance that each station is from the epicenter, use a drawing compass to create a circle around each of the three stations with a radius (in miles) equal to its distance from the epicenter. Use the map of the United States. (Use the distance scale provide on the map to set the distance on the drawing compass for each station.) Figure 3 Table 1: Epicenter Data Table St. Louis, MO Elapsed time between first P and S waves (minutes) Distance from epicenter (miles) Houston, TX Los Angeles, CA Name:_________________________________________ CONCLUSIONS: (answer after locating the epicenter) 1. Did all three of the circles drawn with the compass overlap close to one spot? ________________________________ 2. The earthquake occurred closest to which labeled city? __________________________________________________ The earthquake you located occurred in a well-known seismic zone. On page 224 in your text, read the section on Earthquake Risk. 3. What is the name given to this seismically active region? _________________________________________________ 4. To the best of your ability, use an orange, yellow and green colored pencil to draw the approximate location and associated risk of the seismic zone named in question 3. Name:_________________________________________ Date:___________________________ Block: ________

