Stable Isotope Activity Sheet
advertisement
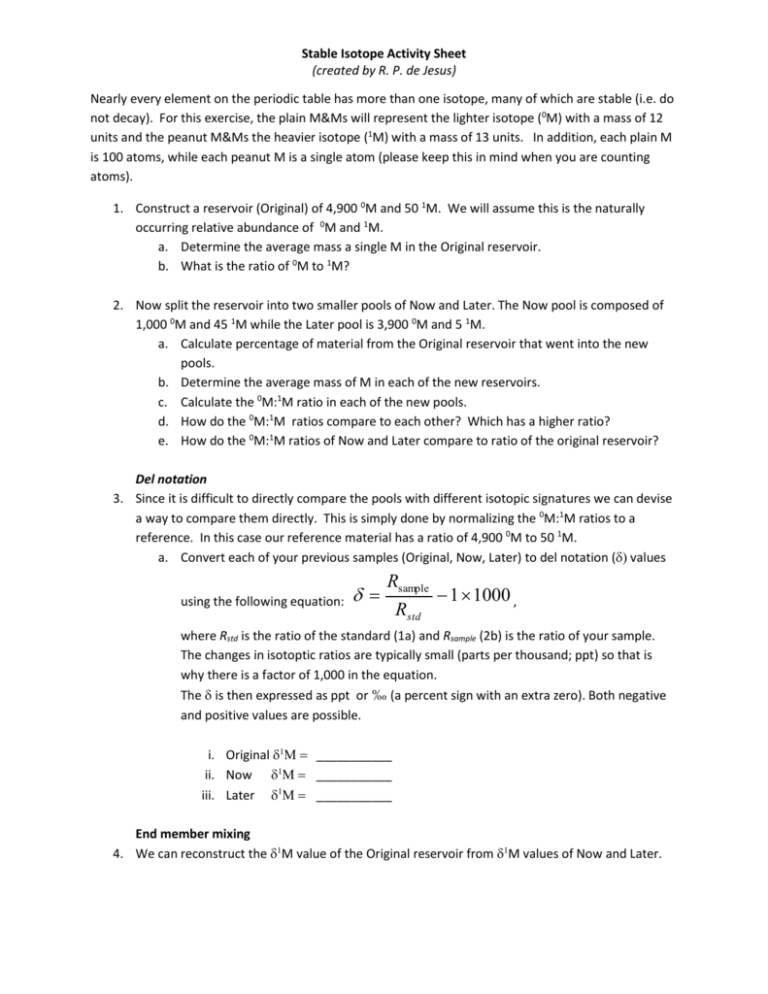
Stable Isotope Activity Sheet (created by R. P. de Jesus) Nearly every element on the periodic table has more than one isotope, many of which are stable (i.e. do not decay). For this exercise, the plain M&Ms will represent the lighter isotope (0M) with a mass of 12 units and the peanut M&Ms the heavier isotope (1M) with a mass of 13 units. In addition, each plain M is 100 atoms, while each peanut M is a single atom (please keep this in mind when you are counting atoms). 1. Construct a reservoir (Original) of 4,900 0M and 50 1M. We will assume this is the naturally occurring relative abundance of 0M and 1M. a. Determine the average mass a single M in the Original reservoir. b. What is the ratio of 0M to 1M? 2. Now split the reservoir into two smaller pools of Now and Later. The Now pool is composed of 1,000 0M and 45 1M while the Later pool is 3,900 0M and 5 1M. a. Calculate percentage of material from the Original reservoir that went into the new pools. b. Determine the average mass of M in each of the new reservoirs. c. Calculate the 0M:1M ratio in each of the new pools. d. How do the 0M:1M ratios compare to each other? Which has a higher ratio? e. How do the 0M:1M ratios of Now and Later compare to ratio of the original reservoir? Del notation 3. Since it is difficult to directly compare the pools with different isotopic signatures we can devise a way to compare them directly. This is simply done by normalizing the 0M:1M ratios to a reference. In this case our reference material has a ratio of 4,900 0M to 50 1M. a. Convert each of your previous samples (Original, Now, Later) to del notation ( values using the following equation: Rsample Rstd 1 1000 , where Rstd is the ratio of the standard (1a) and Rsample (2b) is the ratio of your sample. The changes in isotoptic ratios are typically small (parts per thousand; ppt) so that is why there is a factor of 1,000 in the equation. The is then expressed as ppt or ‰ (a percent sign with an extra zero). Both negative and positive values are possible. i. Original ___________ ii. Now ___________ iii. Later ___________ End member mixing 4. We can reconstruct the M value of the Original reservoir from M values of Now and Later. Stable Isotope Activity Sheet (created by R. P. de Jesus) a. From the percent mass contribution (2a) of two end members, Now and Later, and the M value for each reservoir (3i, ii), how could you reconstruct the M value of the Original reservoir? b. Determine the M value if you mixed a 1:1 ratio of the Now and Later pool. Is the resulting M value more depleted or enriched than the Original reservoir? Fractionation 5. Pretend the Now pool was actually a result of organisms converting the Now reservoir into a M&M chip cookie. a. If additional organisms continued to convert atoms from the Original pool into the cookie pool, what would happen to the M value of the Original pool? (Assume that the Original pool is sufficiently large and won’t run out of material any time soon.) b. In the event that all the M’s were removed from the cookies before being consumed then placed in a jar, what property would distinguish them from the Original pool? 6. Consumption a. Now you can eat your M&Ms


