Nitrous oxide emissions from urban river network
advertisement
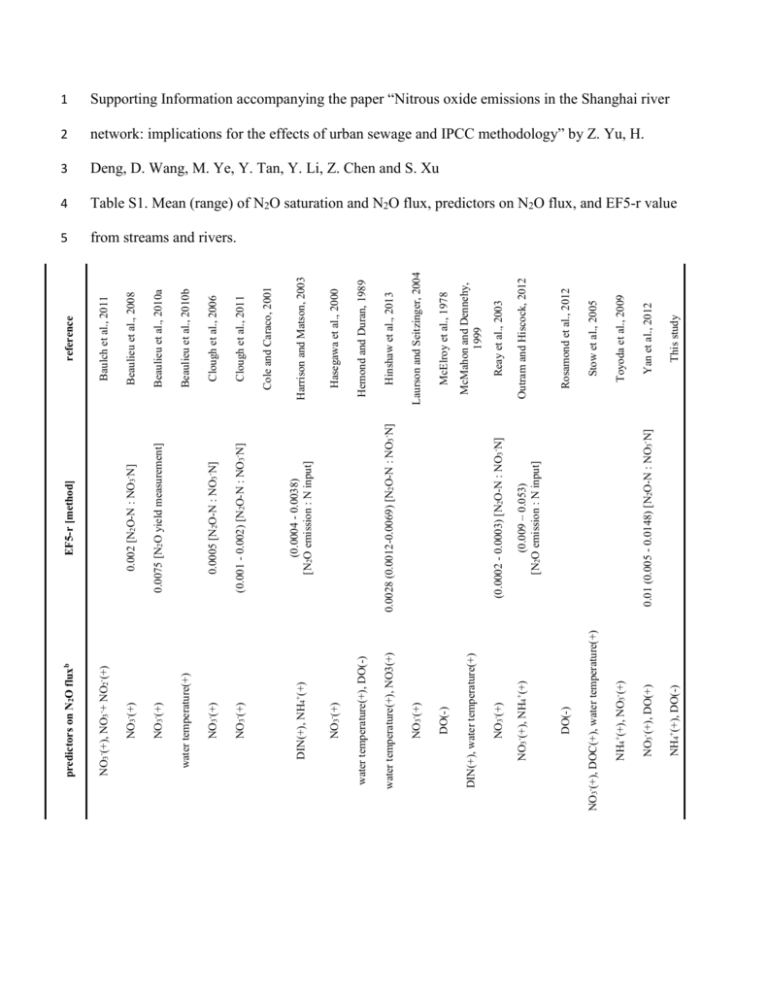
0.0075 [N2O yield measurement] NO3-(+) (0.001 - 0.002) [N2O-N : NO3-N] (0.0004 - 0.0038) [N2O emission : N input] NO3-(+) DIN(+), NH4+(+) NH4+(+), DO(-) This study Yan et al., 2012 NO3-(+), DO(+) 0.01 (0.005 - 0.0148) [N2O-N : NO3-N] Toyoda et al., 2009 NH4+(+), NO3-(+) Outram and Hiscock, 2012 (0.009 – 0.053) [N2O emission : N input] NO3-(+), NH4+(+) Stow et al., 2005 Reay et al., 2003 (0.0002 - 0.0003) [N2O-N : NO3-N] NO3-(+) NO3-(+), DOC(+), water temperature(+) McMahon and Dennehy, 1999 DIN(+), water temperature(+) Rosamond et al., 2012 McElroy et al., 1978 DO(-) DO(-) Laurson and Seitzinger, 2004 NO3-(+) Hinshaw et al., 2013 Hemond and Duran, 1989 water temperature(+), DO(-) water temperature(+), NO3(+) Hasegawa et al., 2000 Harrison and Matson, 2003 Cole and Caraco, 2001 NO3-(+) 0.0028 (0.0012-0.0069) [N2O-N : NO3-N] Clough et al., 2006 0.0005 [N2O-N : NO3-N] NO3-(+) Clough et al., 2011 Beaulieu et al., 2010b water temperature(+) Beaulieu et al., 2010a Beaulieu et al., 2008 0.002 [N2O-N : NO3-N] NO3-(+) reference Baulch et al., 2011 EF5-r [method] NO3-(+), NO3-+ NO2-(+) predictors on N2O fluxb 1 Supporting Information accompanying the paper “Nitrous oxide emissions in the Shanghai river 2 network: implications for the effects of urban sewage and IPCC methodology” by Z. Yu, H. 3 Deng, D. Wang, M. Ye, Y. Tan, Y. Li, Z. Chen and S. Xu 4 Table S1. Mean (range) of N2O saturation and N2O flux, predictors on N2O flux, and EF5-r value 5 from streams and rivers. 6 a: Streams and rivers that affected by WWTPs effluents reported in original papers are noted by 7 “*”. 8 b: “+” and “-” in brackets denote positive and negative relationship between predictor and N2O 9 flux respectively. 10 11 Reference: 12 Clough TJ, Bertram JE, Sherlock RR, Leonard RL, Nowicki BL (2006) Comparison of measured 13 and EF5‐r‐derived N2O fluxes from a spring‐fed river. Global Change Biology, 12(2), 352- 14 363. 171 (110 - 241) (201 - 404) 114 185 (125 - 385) LII River, New Zealand Ashburton River, New Zealand Hudson River, USA 7440 (240 - 56580) 159.1 (54.1 - 1591) 3475 (380 - 18364) 362 (186 - 729) (102 - 209) 2550 (100 - 5000) Agricultural drains, Japan Assabet River, USA* San Joaquin River, USA Small agricultural rivers, USA Potomac River, USA* 770 (103 - 21172) Shanghai river network, China* 80 (0.5 - 2170) (1.87 - 40.8) 12.9 (-9.21 - 64.9) Neuse River, USA 212 (116 - 339) (-40.83 - 4900) Grand River, Canada* Changjiang River, China (900 – 8100) Agricultural drains, rivers, and broads, UK 1051 (93 - 6756) (100 - 1000) Agricultural drains, UK Tama River, Japan* 62 (0.38 - 1360) South Platte River, USA* (11.2 - 1680) (26.2 - 207) 165 (50 - 2450) Agricultural/urban canals, Mexico* 6.4 (2.33 - 22.2) (16 - 30) (12.2 - 623) Ohio River, USA* 35.2 (-8.9 - 266.8) (-3.7 - 905.3) N2O flux (μg N2O-N•m-2•h-1) 53.2 (-14.5 - 541.4 ) 236 (45 - 1358) N2O saturation (%) Headwater streams, USA Low order streams in Kalamazoo River basin, USA Low order streams in southern Ontario, Canada Sitea 15 Clough TJ, Buckthought LE, Casciotti KL, Kelliher FM, Jones PK (2011) Nitrous oxide 16 dynamics in a braided river system, New Zealand. Journal of Environmental Quality, 40(5), 17 1532-1541. 18 19 20 21 Cole JJ and Caraco NF (2001) Emissions of nitrous oxide (N2O) from a tidal, freshwater river, the Hudson River, New York. Environmental science & technology, 35(6), 991-996. Baulch HM, Schiff SL, Maranger R, Dillon PJ (2011) Nitrogen enrichment and the emission of nitrous oxide from streams. Global Biogeochemical Cycles, 25, GB4013. 22 Beaulieu JJ, Arango CP, Hamiltion SK, Tank JL (2008) The production and emission of nitrous 23 oxide from headwater streams in the Midwestern United States. Global Change Biology, 24 14,878-894. 25 26 27 28 29 30 Beaulieu JJ, Tank JL, Hamilton SK et al. (2010a) Nitrous oxide emission from denitrification in stream and river networks. PNAS, 108, 214-219. Beaulieu JJ, Shuster WD, Rebholz JA (2010b) Nitrous oxide emissions from a large, impounded river: The Ohio River. Environmental science & technology, 44(19), 7527-7533. Harrison J and Matson P (2003) Patterns and controls of nitrous oxide emissions from waters draining a subtropical agricultural valley. Global Biogeochemical Cycles, 17, 1080. 31 Hasegawa K, Hanaki K, Matsuo T, Hidaka S (2000) Nitrous oxide from the agricultural water 32 system contaminated with high nitrogen. Chemosphere-Global Change Science, 2(3), 335- 33 345. 34 35 36 37 Hemond HF and Duran AP (1989) Fluxes of N2O at the sediment-water and water-atmosphere boundaries of a nitrogen-rich river. Water Resources Research, 25(5), 839-846. Hinshaw S and Dahlgren R (2012) Dissolved nitrous oxide concentrations and fluxes from the eutrophic San Joaquin River, California. Environmental Science & Technology, in press. 38 Laursen AE and Seitzinger SP (2004) Diurnal patterns of denitrification, oxygen consumption 39 and nitrous oxide production in rivers measured at the whole‐reach scale. Freshwater 40 Biology, 49(11), 1448-1458. 41 42 43 44 45 McElroy MB, Elkins JW, Wofsy SC, Kolb CE, Duran, AP, Kaplan WA (1978) Production and release of N2O from the Potomac Estuary. Limnology and Oceanography, 1168-1182. McMahon PB and Dennehy KF (1999) N2O emissions from a nitrogen-enriched river. Environmental science & technology, 33(1), 21-25. Outram FN and Hiscock K (2012) Indirect nitrous oxide emissions from surface waterbodies in a 46 lowland arable catchment: a significant contribution to agricultural greenhouse gas 47 budgets?. Environmental Science & Technology. 48 49 50 51 Reay D, Smith KA, Edwards AC (2003) Nitrous oxide emission from agricultural drainage waters. Global Change Biology., 9, 195-203. Rosamond MS, Thuss SJ, Schiff SL (2012) Dependence of riverine nitrous oxide emissions on dissolved oxygen levels. Nature Geosciences, 5, 715-718. 52 Stow CA, Walker JT, Cardoch L, Spence P, Geron C (2005) N2O emissions from streams in the 53 Neuse River watershed, North Carolina. Environmental science & technology, 39(18), 6999- 54 7004. 55 Toyoda S, Iwai H, Koba K, Yoshida N (2009) Isotopomeric analysis of N2O dissolved in a river 56 in the Tokyo metropolitan area. Rapid Communications in Mass Spectrometry, 23, 809-821. 57 Yan W, Yang L, Wang F, Wang J, Ma P (2012) Riverine N2O concentrations, exports to estuary 58 and emissions to atmosphere from the Changjing River in response to increasing nitrogen 59 loads. Global Biogeochemical cycles, 26(4). 60 61 Table S2. Agricultural land area and N input from leaching and runoffa 62 N input through leaching and runoff (Gg N•yr-1) rural CM 1185 80 948 9.93 SP 289 1 3 0.03 MH 371 33 122 1.28 urban BS 271 39 106 1.11 JD 464 44 204 2.14 PD 1210 45 545 5.71 SJ 606 54 327 3.43 suburban JS 586 66 387 4.05 QP 670 53 355 3.72 FX 687 64 440 4.61 total 36.00 8 3 a: Multi-year averaged annual discharge of CM rivers are 33.79×10 m (Shanghai Chongming 63 Hydrologic Station, 2007); annual averaged NH4+-N and NO3--N concentrations for CM rivers 64 are 1.25 mg•L-1 and 1.69 mg•L-1, respectively; total area for each district are from Shanghai 65 Statistical Yearbook 2011. total area (km2) agricultural land percentage (%) agricultural land area (km2) 66 67 Reference: 68 Shanghai Chongming Hydrologic Station, 2007. http://file.lw23.com/5/5b/5b1/5b1f8210-a1c2- 69 4c6a-b668-73c55e306c6b.pdf 70 Shanghai Statistical Yearbook 2011. http://www.stats-sh.gov.cn/ (May 24, 2012) 71 72 73 74 75 76 77 Table S3. Sewage discharge and N input from sewage effluentsa total sewage discharge (108 m3) total capacity of WWTPs (108 m3) untreated sewage to the rivers (108 m3) Sewage effluents to the rivers (108 m3) N input from untreated sewage (Gg N•yr-1) N input from treated sewage (Gg N•yr-1) 2009 23.05 17.16 5.89 2.19 21.14 4.37 2010 24.82 18.97 5.85 3.50 21.02 7.00 average 23.94 18.06 5.87 2.84 21.08 5.69 78 a: total sewage discharge and total capacity of WWPTs were collected from Shanghai Statistical 79 Yearbook 2011; sewage effluents to the river network is the difference between total capacity of 80 WWTPs and treated sewage being released to open sea (14.98×10⁸ t and 15.46×10⁸ t for 2009 81 and 2010 respectively; data from Shanghai Water Bureau). 82 83 Reference: 84 Shanghai Water Bureau. http://www.shanghaiwater.gov.cn/swEng/index.jsp (Feburary 10, 2012) 85 Shanghai Statistical Yearbook 2011. http://www.stats-sh.gov.cn/ (May 24, 2012)
