Ordination Study Notes
advertisement
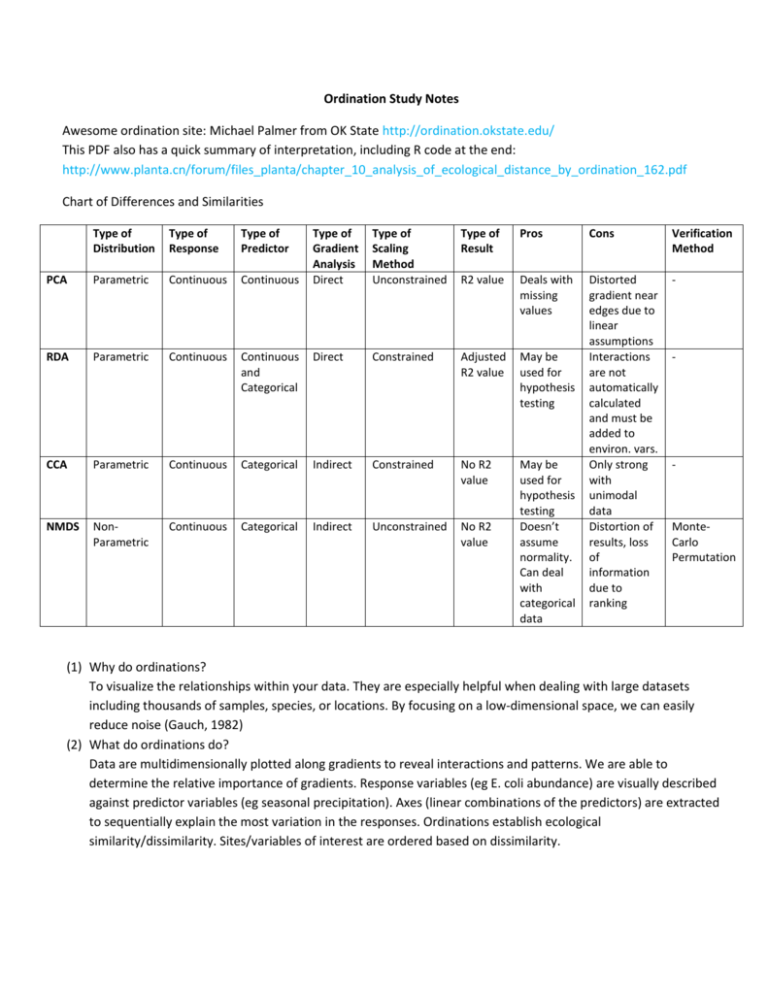
Ordination Study Notes Awesome ordination site: Michael Palmer from OK State http://ordination.okstate.edu/ This PDF also has a quick summary of interpretation, including R code at the end: http://www.planta.cn/forum/files_planta/chapter_10_analysis_of_ecological_distance_by_ordination_162.pdf Chart of Differences and Similarities Type of Distribution Type of Response Type of Predictor Type of Gradient Analysis Direct Type of Scaling Method Unconstrained Type of Result Pros Cons Verification Method PCA Parametric Continuous Continuous R2 value Deals with missing values - Continuous and Categorical Direct Constrained Adjusted R2 value May be used for hypothesis testing Continuous Categorical Indirect Constrained No R2 value Continuous Categorical Indirect Unconstrained No R2 value May be used for hypothesis testing Doesn’t assume normality. Can deal with categorical data Distorted gradient near edges due to linear assumptions Interactions are not automatically calculated and must be added to environ. vars. Only strong with unimodal data Distortion of results, loss of information due to ranking RDA Parametric Continuous CCA Parametric NMDS NonParametric - - MonteCarlo Permutation (1) Why do ordinations? To visualize the relationships within your data. They are especially helpful when dealing with large datasets including thousands of samples, species, or locations. By focusing on a low-dimensional space, we can easily reduce noise (Gauch, 1982) (2) What do ordinations do? Data are multidimensionally plotted along gradients to reveal interactions and patterns. We are able to determine the relative importance of gradients. Response variables (eg E. coli abundance) are visually described against predictor variables (eg seasonal precipitation). Axes (linear combinations of the predictors) are extracted to sequentially explain the most variation in the responses. Ordinations establish ecological similarity/dissimilarity. Sites/variables of interest are ordered based on dissimilarity. (3) What is the difference between a direct and an indirect gradient analysis? Direct analyses present responses directly against predictors and indirect analyses present responses against clusters of predictors. (4) Examples of plots and how to interpret them - Arrows show the direction and relatedness of predictors. - Arrows with smaller angles between them are more correlated. - Sites closer together are more similar. - Sites towards the point of an arrow are more strongly positively related to that predictor. Sites towards the tail of an arrow or further in that direction are more strongly negatively related to that predictor. - Site toward the origin of the plot are more generalist and are not strongly influenced by the predictors. PCA – Vermaire et al, 2011 RDA – Vermaire et al, 2011 CCA – Nalesso et al, 2005 NMDS – Metz et al, 2011 References Gauch, H.G. Jr, 1982. Multivariate analysis in community structure. Cambridge University Press, Cambridge. Metz, M.R., K.M. Frangioso, R.K. Meentemever, D.M. Rizzo. 2011. Interacting disturbances: wildfire severity affected by stage of forest disease invasion. Ecological Applications 21:313-320. Nalesso, R.C., J-C. Joyeux, C.O. Quintana, E. Torezani, A C Paz Otegui, 2005. Soft-bottom macrobenthic communities of Vitoria Bay estuarine system, South-eastern Brazil. Brazil Journal of Oceanography, 53(1/2):23-38. Vermaire, J.C., Y.T. Prairie, I. Gregory-Eaves, 2011. The influence of submerged macrophytes on sedimentary diatom assemblages

