Spring Final Exam Study Guide Name: Date: Conics 1. Classify each
advertisement
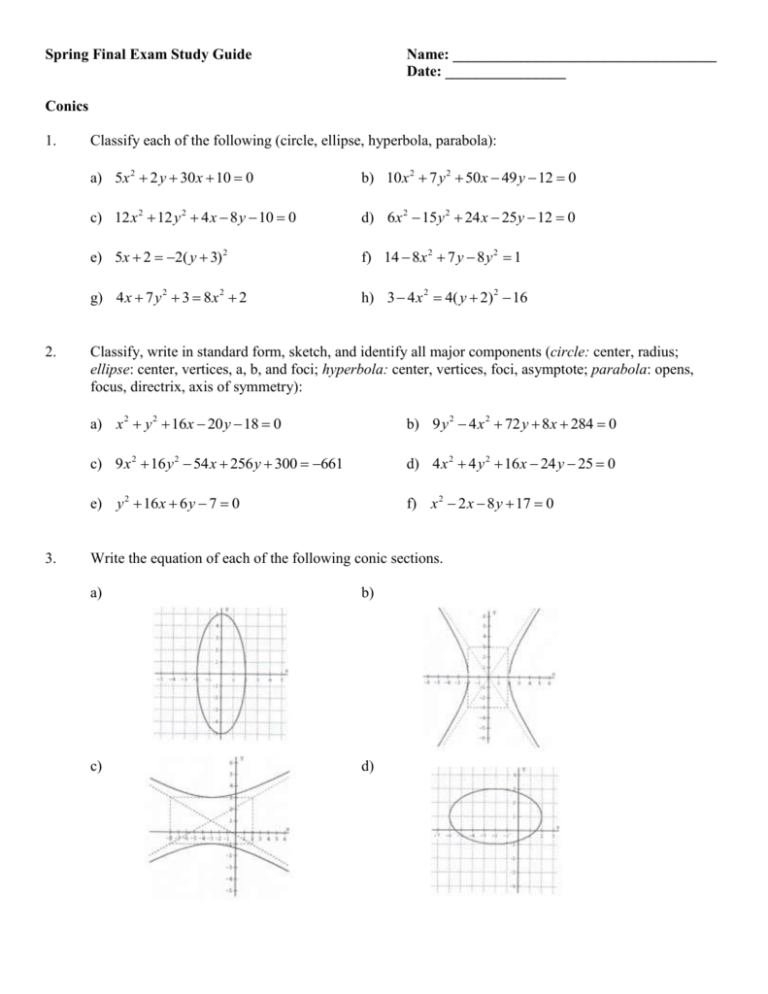
Spring Final Exam Study Guide Name: ___________________________________ Date: ________________ Conics 1. 2. 3. Classify each of the following (circle, ellipse, hyperbola, parabola): a) 5x 2 2 y 30 x 10 0 b) 10x 2 7 y 2 50 x 49 y 12 0 c) 12 x 2 12 y 2 4 x 8 y 10 0 d) 6x 2 15 y 2 24 x 25y 12 0 e) 5x 2 2( y 3) 2 f) 14 8x 2 7 y 8 y 2 1 g) 4 x 7 y 2 3 8 x 2 2 h) 3 4 x 2 4( y 2) 2 16 Classify, write in standard form, sketch, and identify all major components (circle: center, radius; ellipse: center, vertices, a, b, and foci; hyperbola: center, vertices, foci, asymptote; parabola: opens, focus, directrix, axis of symmetry): a) x 2 y 2 16x 20 y 18 0 b) 9 y 2 4 x 2 72 y 8 x 284 0 c) 9 x 2 16 y 2 54 x 256 y 300 661 d) 4 x 2 4 y 2 16 x 24 y 25 0 e) y 2 16 x 6 y 7 0 f) x 2 2 x 8 y 17 0 Write the equation of each of the following conic sections. a) b) c) d) 4. Write an equation in standard form using the given information: a) parabola: directrix : y = 4; focus at (4, 6) b) hyperbola: vertices (2,5) and (2,1) Slope of asymptotes: 1/2 c) circle: center at (4,-2), containing the point (-12, -16) d) circle: endpoints of the diameter at (6,3) and (-4,11) e) circle: center at (-2,5); tangent to the x-axis f) ellipse: vertices at (8,3) and (8,-13); minor axis is 6 units long g) parabola: focus at (1,3); vertex at (1,-2) Data Analysis – Normal Probability Distribution 5. Vocabulary: Sample Simple Random Sample Systematic Sample Cluster Sample Stratified Random Sample Explanatory Variable Response Variable Bias Confounding Variable σ µ Σ z-score 6. Draw and label the empirical rule for normal distributions with the percentages of data that fall within each set of standard deviation. 7. You have normally distributed data with a mean of 115.6 and standard deviation of 6.8. a) What percent of the values are above 102.4? b) What percent of the values are below 92.7? c) What is the probability that a value will be between 112.9 and 121.7? 8. Scores are normally distributed with a mean of 85.1 and standard deviation 7.8. a) What percentage of scores are below 0.8 standard deviations below the mean? b) What percentage of scores are above .2 standard deviations above the mean? c) What percentage of scores are within 1.3 standard deviations? 9. Below is a frequency table for a spinner numbered 0 through 4. The results 0 through 4 are not equally likely. Use the frequency table to find the probability of rolling a 2. Result 0 1 2 3 4 10. Number of spins 9 Find the mean and standard deviation of the data represented by the probability histogram. 3 6 8 4 11. The probability P(49.5 x 510 . ) , on a normal distribution with a mean of 48.7 and a standard deviation of 4.0, what is the probability? 12. The Wechler Adult Intelligence Test Scale is composed of a number of subtests. On one subtest, the raw scores have a mean of 35 and a standard deviation of 6. Assuming the raw scores form a normal distribution, a) What is the probability of getting a raw score less than 30? b) What is the probability of getting a raw score greater than 40? c) What is the probability of getting a raw score between 30 and 40? 13. Use the histogram to answer the question below. Is the mean greater than, less than, or almost equal to the median? Explain. 14. Name the type of sampling method used for each of the following: a) Students were arranged alphabetically by last name, and every third student was surveyed. b) A random number generator was used to select 8 numbers from 1 – 30, corresponding to a numbered class list of students. c) Students from a class list were first sorted by first letter of last name, and then assigned a number within each group. One student was randomly selected from each numbered group. d) Students were separated by age, and all 13-year-old students were surveyed. 15. Classify each question below as biased or unbiased. a) Do you actually think classical music is worth listening to? b) On a weekly basis, do you listen to classical music at least once? c) Can anyone really like classical music? d) On a weekly basis, do you listen to ancient, outdated classical music? 16. A pharmaceutical company has released a new medication to treat heartburn. The company has designed an experimental study to determine the length of time between taking the medication and experiencing heartburn relief. The company has resources to monitor 200 total study participants who suffer from heartburn. Recall that in studies involving medications, placebos are usually administered as an alternative to the new medication. a) What are the experimental units of study? b) What is the explanatory variable? c) What is the treatment? d) What is the response variable? e) Draw a diagram to outline the design of the study. 17. a) A normal distribution has a mean of 18.0 and a standard deviation of 1.7. Which z-score corresponds to the data value 17.5 on the standard normal curve? b) A normal distribution has a mean of 3.15 and a standard deviation of 0.81. Which z-score corresponds to the data value 17.5 on the standard normal curve? c) A normal distribution has a mean of 65” and a standard deviation of 3.5”. Which data value corresponds to a z-score of -1.5? Data Analysis – Binomial Probabilities 18. What are the conditions for a situation to be “binomial”? 19. Bags of plain M&M’s contain 30% brown candies. One candy is selected from each of 12 bags. You are counting the number of brown candies that are selected. Is this a binomial situation or not? Why? 20. One in four adults is currently on a diet. Of a random sample of eight adults, what is the probability that the number currently on a diet (a) exactly three? (b) less than three? (c) at least two? 21. During the past three months, 67% of Atlantans went out to the movies. Consider a random sample of 25 Atlantans who are asked if they went to the movies in the past three months. Find the mean and standard deviation of samples of 25. 22. Fifty-four percent of men consider themselves basketball fans. You randomly select 10 men and ask each if he considers himself a basketball fan. Find the probability that the number who consider themselves basketball fans is (a) exactly eight 23. 24. (b) at least eight (c) less than two Assume that 54% of pepper seeds that are sown directly in the ground produce plants. If Julia plants 25 seeds, what is the probability that 18 plants will be produced? 1 The probability if Chris’s making a free throw is . Find each probability if she shoots 5 times. 3 (a) P(all missed) (b) P(all made)


