Review Topic E Part II: Mapping the Earth
advertisement
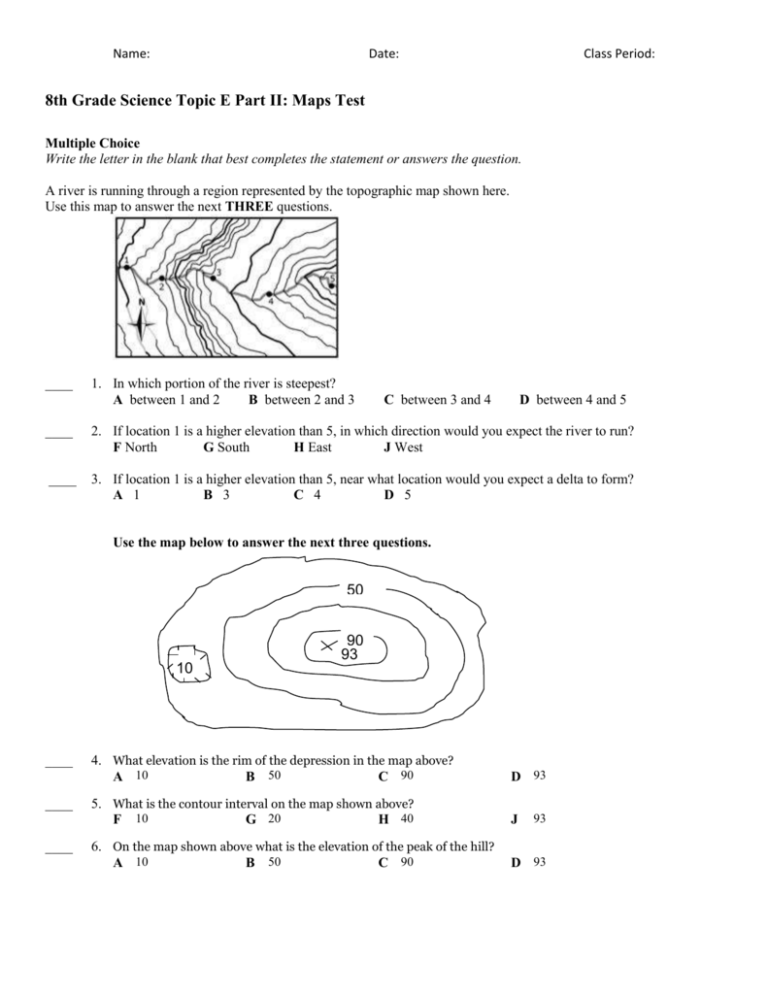
Name: Date: Class Period: 8th Grade Science Topic E Part II: Maps Test Multiple Choice Write the letter in the blank that best completes the statement or answers the question. A river is running through a region represented by the topographic map shown here. Use this map to answer the next THREE questions. ____ 1. In which portion of the river is steepest? A between 1 and 2 B between 2 and 3 C between 3 and 4 D between 4 and 5 ____ 2. If location 1 is a higher elevation than 5, in which direction would you expect the river to run? F North G South H East J West ____ 3. If location 1 is a higher elevation than 5, near what location would you expect a delta to form? A 1 B 3 C 4 D 5 Use the map below to answer the next three questions. 50 90 93 10 ____ ____ ____ 4. What elevation is the rim of the depression in the map above? A 10 B 50 C 90 D 93 5. What is the contour interval on the map shown above? F 10 G 20 H 40 J 6. On the map shown above what is the elevation of the peak of the hill? A 10 B 50 C 90 D 93 93 Name: Date: Class Period: A topographic map is shown below. The topographic map above shows the elevation of nature trails in a state park. The first trail extends from the point labeled X to the summit, labeled Y. The second trail extends from the point labeled Z to the summit, labeled Y (on the 1200 m contour line). ____ 7. What is the contour interval of the map? (Record your numeric answer in the blank to the left.) ____ 8. Which trail is least steep? A X-Y B Y-X C Z-Y D 1200 9. What is the change in elevation for the steepest trail from the beginning of the trail to the summit? Record your numeric ____ answer in the blank to the left. ____ 10. The Appalachian Mountains are an example of a folded mountain range. They are very old and weathered and have no major plate tectonic activity near them. Which statement below describes how these mountains would have appeared in the past? A The mountains would have decreased their elevation over time. B The mountains would have been more steep and jagged in previous times. C The mountains would have been even more rounded and less steep in previous times. D The mountains would have remained unchanged over time. ____ 11. How many hills are represented in the topographic map above? State the number in the blank to the left. ____ 12. If you weathered the formation represented above for a number of years, it could reshape the: F top of the land form to increase elevation H land form to create a canyon top of the land form to decrease elevation G J right side of the land form to create a cave ____ 13. What is the name of the area between the two high points shown on the map above? A glacier B peaks C valley or saddle D ridge or trench Name: Date: Class Period: Contour Interval = 50 m ____ 14. What is the lowest area on the map above? F 200 m G 100 m H 50 m J 0m C 50 m D 0m ____ 15. What is the contour interval above? A 200 m B 100 m ____ 16. What is the elevation change from one red dot to the next red dot? F 200 m G 150 m H 100 m J 50 m ____ 17. Which of the above topographic maps is probably older? A left B right C neither D both ____ 18. What direction would the river represented in the two maps above be flowing? F East G West H North J South ____ 19. How would the water flow represented in the older topographic map above on the left compare with the water flow represented by the newer topographic map on the right? A Left map is flowing more slowly to the right C Left map is flowing faster to the left B Left map is flowing more slowly to the left D Left map is flowing faster to the right ____ 20. How would the water flow represented in the older topographic map above on the left affect the water flow represented by the newer topographic map on the right? F Right map is flowing more slowly to the right G Right map is flowing more slowly to the left H right map is flowing faster to the left J Right map is flowing faster to the right ____ 21. Why would the water flow represented in the older topographic map above on the left compare so differently with the water flow represented by the newer topographic map on the right? A Left map shows an eroded channel flowing C Right map shows an eroded channel flowing right left Left map shows deposited sediment flowing B D right map shows deposited sediment flowing right left Name: Date: 8th Grade Science Topic E: Maps Test Answer Section MULTIPLE CHOICE 1. 2. 3. 4. 5. 6. 7. 8. 9. 10. 11. 12. 13. 14. 15. 16. 17. 18. 19. 20. 21. ANS: ANS: ANS: ANS: ANS: Ans: ANS: ANS: ANS: ANS: ANS: ANS: ANS: ANS: ANS: ANS: ANS: Ans: ANS: ANS: ANS: B H D A G D 20 C 140 B 2 G C F C G A G B H C Class Period:
