Weekly report - Murray-Darling Basin Authority
advertisement
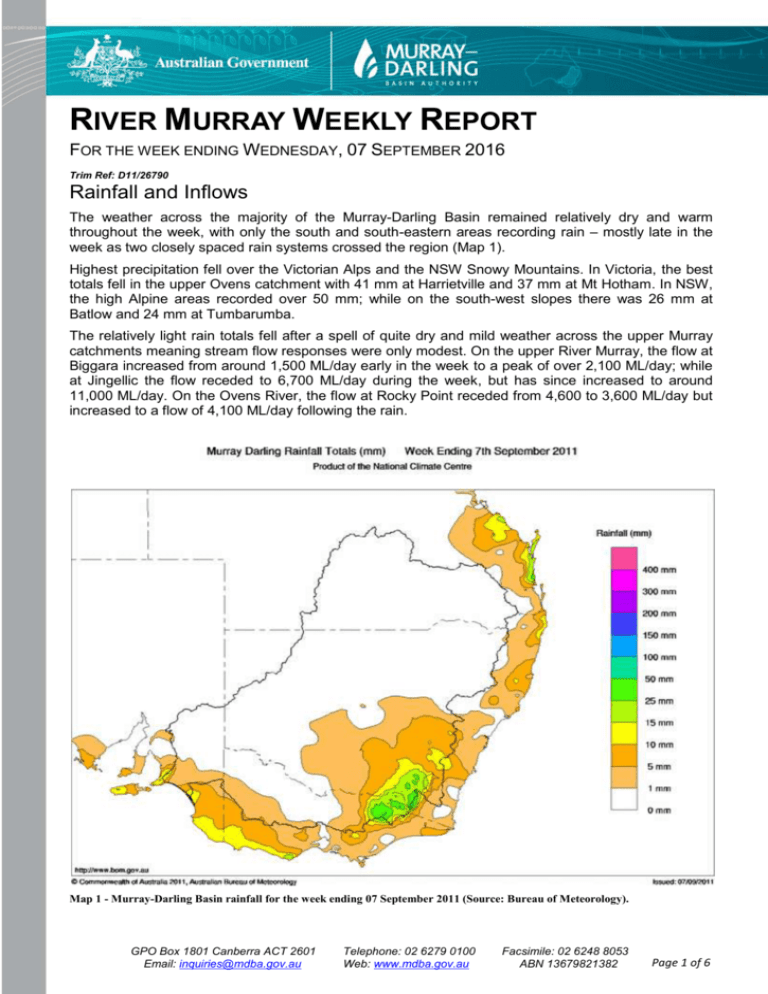
RIVER MURRAY WEEKLY REPORT FOR THE WEEK ENDING WEDNESDAY, 07 SEPTEMBER 2016 Trim Ref: D11/26790 Rainfall and Inflows The weather across the majority of the Murray-Darling Basin remained relatively dry and warm throughout the week, with only the south and south-eastern areas recording rain – mostly late in the week as two closely spaced rain systems crossed the region (Map 1). Highest precipitation fell over the Victorian Alps and the NSW Snowy Mountains. In Victoria, the best totals fell in the upper Ovens catchment with 41 mm at Harrietville and 37 mm at Mt Hotham. In NSW, the high Alpine areas recorded over 50 mm; while on the south-west slopes there was 26 mm at Batlow and 24 mm at Tumbarumba. The relatively light rain totals fell after a spell of quite dry and mild weather across the upper Murray catchments meaning stream flow responses were only modest. On the upper River Murray, the flow at Biggara increased from around 1,500 ML/day early in the week to a peak of over 2,100 ML/day; while at Jingellic the flow receded to 6,700 ML/day during the week, but has since increased to around 11,000 ML/day. On the Ovens River, the flow at Rocky Point receded from 4,600 to 3,600 ML/day but increased to a flow of 4,100 ML/day following the rain. Map 1 - Murray-Darling Basin rainfall for the week ending 07 September 2011 (Source: Bureau of Meteorology). GPO Box 1801 Canberra ACT 2601 Email: inquiries@mdba.gov.au Telephone: 02 6279 0100 Web: www.mdba.gov.au Facsimile: 02 6248 8053 ABN 13679821382 Page 1 of 6 August 2011 Summary Rainfall for August averaged 32.2 mm across the Murray-Darling Basin (51st driest out of 112 years of record), with the majority of the Basin observing average or close to average conditions (Map 2). Murray system inflows (excluding Snowy releases and Menindee inflows) for August were about 1,700 GL. This is higher than August last year (1,570 GL) and the long term average for August (1,540 GL), demonstrating the responsiveness of the wet catchment and also the possible contributions from snow melt in maintaining good base stream flows. Map 2 - Murray-Darling Basin rainfall for August 2011 (Source: Bureau of Meteorology). River Operations MDBA active storage increased by 16 GL this week to 7,403 GL (86% capacity). At Dartmouth Reservoir, the storage rose by 23 GL to 2,736 GL, which is 71 % capacity. The release was maintained at the normal minimum of 200 ML/day. At Hume Reservoir this week, releases were increased to 12,000 ML/day as the storage was initially lowered to create airspace in anticipation of increased inflows from forecast rain. However, with inflows on the lower end of the forecast, releases are now being reduced again and are currently around 9,500 ML/day. The storage is currently 2,947 GL (98% capacity), which is near where it started the week. The storage is expected to continue rising over the coming week, however operations will be affected by rainfall and demand forecasts, which remain under close and constant review. GPO Box 1801 Canberra ACT 2601 Email: inquiries@mdba.gov.au Telephone: 02 6279 0100 Web: www.mdba.gov.au Facsimile: 02 6248 8053 ABN 13679821382 Page 2 of 6 At Yarrawonga Weir, the lake level is currently 124.76 m AHD. Releases were reduced from 18,800 ML/day back to 14,000 ML/day during the week, and are expected to reduce further to around 12,000 ML/day over the next couple of days. Relatively little rain fell around the irrigation districts this week and demand has increased from 1,700 ML/day to 3,750 ML/day at the Mulwala Canal and from 350 ML/day to 1,500 ML/day at the Yarrawonga Main Channel. On the Edward River, the flow at Deniliquin peaked during the week at around 17,000 ML/day. Flow downstream of Stevens Weir peaked around 13,000 ML/day and is currently around 9,900 ML/day. Further downstream on the Wakool River, the flow at Stoney Crossing is 8,700 ML/day and is expected to rise to around 12,000 ML/day by the middle of September. At Torrumbary Weir, the pool has returned to full supply level. Diversions to the National Channel are currently 1,700 ML/day and are forecast to rise to 3,500 ML/day in the coming week. The flow downstream of the weir has continued to fall away and is currently around 23,700 ML/day. Further downstream, the flow is expected to peak at Swan Hill at around 22,500 ML/day in the next few days while the inflow from the Murrumbidgee River is around 9,400 ML/day and is expected to hold around this level for another week. The flow at Euston is currently 34,400 ML/day and expected to continue to rise over the coming week. The Menindee Lakes remain surcharged at 1,939 GL (112% capacity). Pulsed flows past Weir 32 ranged between 1,000 ML/day and 400 ML/day; while the flow at Burtundy has fallen away to 300 ML/day. At the confluence of the Murray and Darling Rivers, the flow at Wentworth is 33,100 ML/day and rising. Lake Victoria water level was lowered to 25 m AHD over the past few weeks in order to help maintain and protect vegetation as part of the Lake Victoria Operating Strategy. However, with upstream irrigation demand increasing, and assuming a drier outlook, the Lake is now being refilled so that it can assist in meeting downstream flow requirements over the coming summer. Flow to South Australia fell away over the week from 37,000 ML/day back to 25,300 ML/day, but is expected to begin climbing again in the next few days. The average level in the Lower Lakes is currently 0.54m AHD. The level will begin rising again over the coming week and be at 0.85 m AHD by the end of September. For media inquiries contact the Media Officer on 02 6279 0141 DAVID DREVERMAN Executive Director, River Murray GPO Box 1801 Canberra ACT 2601 Email: inquiries@mdba.gov.au Telephone: 02 6279 0100 Web: www.mdba.gov.au Facsimile: 02 6248 8053 ABN 13679821382 Page 3 of 6 Water in Storage Week ending Wednesday 07 Sep 2011 Full Supply Level MDBA Storages Dartmouth Reservoir Hume Reservoir Lake Victoria Menindee Lakes Total Total Active MDBA Storage Current Storage Level Full Supply Volume (m AHD) 486.00 192.00 27.00 (GL) 3 856 3 005 677 1 731* 9 269 Major State Storages Burrinjuck Reservoir Blowering Reservoir Eildon Reservoir (m AHD) 467.10 191.71 25.04 Current Storage (GL) 2 736 2 947 455 1 939 8 077 % 71% 98% 67% 112% 87% 996 1 582 3 190 97% 97% 96% 1 026 1 631 3 334 Dead Storage (GL) Active Storage 71 23 100 (480 #) -- (GL) 2 665 2 924 355 1 459 7 403 86% ^ 3 24 100 993 1 558 3 090 Change in Total Storage for the Week (GL) +23 +9 -3 -11 +17 -9 -3 +18 * Menindee surcharge capacity – 2050 GL ** All Data is rounded to nearest GL ** # NSW takes control of Menindee Lakes when storage falls below 480 GL, and control reverts to MDBA when storage next reaches 640 GL ^ % of total active MDBA storage Snowy Mountains Scheme Storage Lake Eucumbene - Total Snowy-Murray Component Target Storage Snowy diversions for week ending 06 Sep 2011 Active Storage (GL) 1 583 398 1 240 Weekly Change (GL) n/a n/a Diversion (GL) From 1 May 2011 274 122 152 414 This Week Snowy-Murray Tooma-Tumut Net Diversion Murray 1 Release +1 +8 -7 +11 Major Diversions from Murray and Lower Darling (GL) * New South Wales This Week Murray Irrig. Ltd (Net) Wakool Sys Allowance Western Murray Irrigation Licensed Pumps Lower Darling TOTAL 21.6 0.0 0.3 1.5 0.2 23.6 From 1 July 2011 87 0 1 11 2 101 Victoria This Week Yarrawonga Main Channel (net) Torrumbarry System + Nyah (net) Sunraysia Pumped Districts Licensed pumps - GMW (Nyah+u/s) Licensed pumps - LMW TOTAL 4.4 0 1.2 0.3 3.7 9.6 From 1 July 2011 7 21 5 2 15 50 * Figures derived from estimates and monthly data. Please note that not all data may have been available at the time of creating this report. ** All data above is rounded to nearest 100 ML for weekly data and nearest GL for cumulative data** Flow to South Australia (GL) * Flow to SA will be greater than entitlement for September due to Additional Dilution Flow and Unregulated Flows. Salinity (EC) Entitlement this month Flow this week Flow so far this month Flow last month 135.0 * 217.2 217.2 1,082.2 (31 000 ML/day) (microSiemens/cm at 25o C) Current Swan Hill Euston Red Cliffs Merbein Burtundy (Darling) Lock 9 Lake Victoria Berri Waikerie Morgan Mannum Murray Bridge Milang (Lake Alex.) Poltalloch (Lake Alex.) Meningie (Lake Alb.) Goolwa Barrages Average over the last week 220 130 120 100 360 110 210 170 230 190 190 630 240 5 850 720 GPO Box 1801 Canberra ACT 2601 Email: inquiries@mdba.gov.au Average since 1 August 2011 160 130 110 90 340 100 190 160 210 180 180 560 250 5 810 590 Telephone: 02 6279 0100 Web: www.mdba.gov.au 130 110 110 90 340 110 200 180 220 220 220 570 290 5 490 950 Facsimile: 02 6248 8053 ABN 13679821382 Page 4 of 6 River Levels and Flows Week ending Wednesday 07 Sep 2011 7.3 - 2.39 1.87 2.60 2.91 1.87 2.99 2.17 3.08 6.08 3.62 7.30 4.89 4.78 5.72 2.45 208.91 218.76 156.23 151.38 149.31 129.01 117.21 106.92 84.63 66.54 56.42 46.73 29.54 22.65 - (ML/day) 3 750 10 800 1 750 11 000 13 340 13 300 14 060 17 020 23 680 22 240 33 750 34 360 28 810 33 100 25 290 39 200 F R R F R F F F F S R R F R F F (ML/day) 3 020 8 410 1 480 10 340 12 450 11 800 16 700 19 950 27 210 21 950 31 750 32 390 28 810 32 000 30 840 40 190 Average Flow last Week (ML/day) 3 240 9 540 1 810 11 070 13 550 17 930 33 850 41 240 33 860 21 070 29 330 29 630 34 570 39 870 37 110 2.7 11.9 9.0 5.0 - 2.24 9.64 2.96 4.85 4.51 4.15 5.45 3.63 4.16 0.82 155.47 147.32 94.38 84.62 59.89 57.64 61.41 - 2 540 5 600 3 750 9 880 5 630 8 660 9 400 1 360 590 300 R R F S R R S R F F 2 200 5 830 6 870 12 040 5 210 6 600 9 120 730 700 500 2 720 9 000 13 840 10 910 4 000 4 340 4 310 120 950 710 14 280 18 660 Minor Flood Stage River Murray Khancoban Jingellic Tallandoon ( Mitta Mitta River ) Heywoods Doctors Point Albury Corowa Yarrawonga Weir (d/s) Tocumwal Torrumbarry Weir (d/s) Swan Hill Wakool Junction Euston Weir (d/s) Mildura Weir (d/s) Wentworth Weir (d/s) Rufus Junction Blanchetown (Lock 1 d/s) (m) Tributaries Kiewa at Bandiana Ovens at Wangaratta Goulburn at McCoys Bridge Edward at Stevens Weir (d/s) Edward at Liewah Wakool at Stoney Crossing Murrumbidgee at Balranald Barwon at Mungindi Darling at Bourke Darling at Burtundy Rocks Gauge local (m) 4.0 4.2 5.5 5.5 4.3 7.0 6.4 6.4 7.3 4.5 8.8 8.8 Height (m AHD) Flow Trend Average Flow this Week Natural Inflow to Hume (i.e. Pre Dartmouth & Snowy Mountains scheme) Weirs and Locks Pool levels above or below Full Supply Level (FSL) Murray Yarrawonga No. 26 Torrumbarry No. 15 Euston No. 11 Mildura No. 10 Wentworth No. 9 Kulnine No. 8 Wangumma Lower Lakes FSL (m AHD) 124.90 86.05 47.60 34.40 30.80 27.40 24.60 u/s -0.14 +0.00 -0.28 +0.04 +0.03 -0.06 -0.48 d/s +1.93 +2.14 +0.95 +1.88 FSL (m AHD) 22.10 19.25 16.30 13.20 9.80 6.10 3.20 No. 7 Rufus River No. 6 Murtho No. 5 Renmark No. 4 Bookpurnong No. 3 Overland Corner No. 2 Waikerie No. 1 Blanchetown u/s +0.70 -0.05 +0.01 -0.21 -0.00 +0.18 +0.06 d/s +3.43 +1.72 +1.49 +2.62 +2.30 +2.60 +1.70 FSL = 0.75 m AHD Lake Alexandrina average level for the past 5 days (m AHD) Barrages 0.54 Fishways at Barrages Openings Level (m AHD) No. Open Goolwa 128 openings All closed Mundoo 26 openings 0.58 All closed Boundary Creek 6 openings 1 Ewe Island 111 gates 20 Tauwitchere 322 gates 0.61 60 AHD = Level relative to Australian Height Datum, i.e. height above sea level GPO Box 1801 Canberra ACT 2601 Email: inquiries@mdba.gov.au Rock Ramp Telephone: 02 6279 0100 Web: www.mdba.gov.au Open Vertical Slot Open Open Facsimile: 02 6248 8053 ABN 13679821382 Page 5 of 6 Week ending Wednesday 07 Sep 2011 State Allocations (as at 07 Sep 2011) NSW - Murray Valley High security General security Victorian - Murray Valley 97% 15% NSW – Murrumbidgee Valley High security General security NSW : VIC : SA : 61% 0% Victorian - Goulburn Valley 95% 57% High reliability Low reliability 87% 0% South Australia – Murray Valley NSW - Lower Darling High security General security High reliability Low reliability 100% 100% High security 100% http://www.water.nsw.gov.au/About-us/Media-releases/media/default.aspx http://www.g-mwater.com.au/water-resources/allocations/current.asp http://www.waterforgood.sa.gov.au/category/news/ GPO Box 1801 Canberra ACT 2601 Email: inquiries@mdba.gov.au Telephone: 02 6279 0100 Web: www.mdba.gov.au Facsimile: 02 6248 8053 ABN 13679821382 Page 6 of 6
