Weather Jiggsaw Activity Answer Key
advertisement
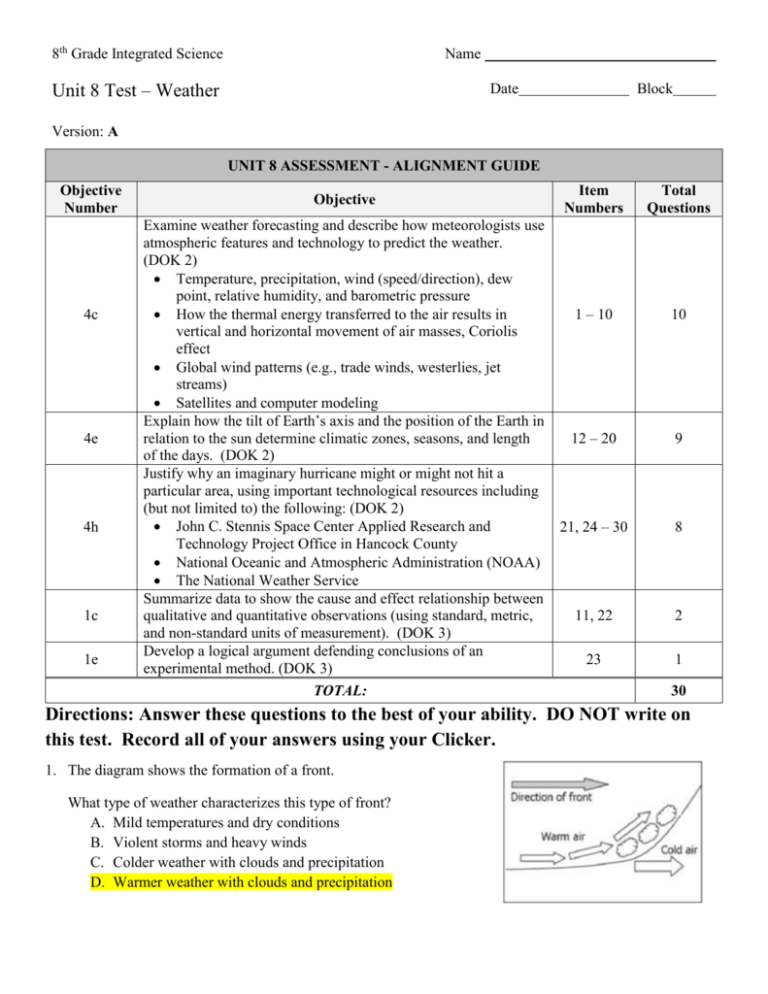
8th Grade Integrated Science Name Unit 8 Test – Weather Date Block Version: A UNIT 8 ASSESSMENT - ALIGNMENT GUIDE Objective Number 4c 4e 4h 1c 1e Objective Examine weather forecasting and describe how meteorologists use atmospheric features and technology to predict the weather. (DOK 2) Temperature, precipitation, wind (speed/direction), dew point, relative humidity, and barometric pressure How the thermal energy transferred to the air results in vertical and horizontal movement of air masses, Coriolis effect Global wind patterns (e.g., trade winds, westerlies, jet streams) Satellites and computer modeling Explain how the tilt of Earth’s axis and the position of the Earth in relation to the sun determine climatic zones, seasons, and length of the days. (DOK 2) Justify why an imaginary hurricane might or might not hit a particular area, using important technological resources including (but not limited to) the following: (DOK 2) John C. Stennis Space Center Applied Research and Technology Project Office in Hancock County National Oceanic and Atmospheric Administration (NOAA) The National Weather Service Summarize data to show the cause and effect relationship between qualitative and quantitative observations (using standard, metric, and non-standard units of measurement). (DOK 3) Develop a logical argument defending conclusions of an experimental method. (DOK 3) TOTAL: Item Numbers Total Questions 1 – 10 10 12 – 20 9 21, 24 – 30 8 11, 22 2 23 1 30 Directions: Answer these questions to the best of your ability. DO NOT write on this test. Record all of your answers using your Clicker. 1. The diagram shows the formation of a front. What type of weather characterizes this type of front? A. Mild temperatures and dry conditions B. Violent storms and heavy winds C. Colder weather with clouds and precipitation D. Warmer weather with clouds and precipitation The diagram shows the major air masses affecting weather in the United States. Use this to answer questions 2 and 3. 2. Which air masses bring dry air to the United States? A. 1 and 6 B. 3 and 4 C. 2 and 5 D. 4 and 5 3. Based on the diagram, what can be concluded about the air found in the location marked “Z” on the map? A. It is warm and dry. B. It is cool and humid. C. It is cool and dry. D. It is warm and humid. 4. Anne is studying weather factors in science class. She built several tools to measure different weather factors. Which factor is Anne measuring and what is the name of the instrument in the diagram? A. Barometer; used to measure air pressure. B. Barometer; used to measure wind speed. C. Anemometer; used to measure wind speed. D. Anemometer; used to measure air pressure. 5. The diagram shows the movement of air at the beach on a hot day. Which statement explains the direction of air movement? A. Warm air over the land rises, causing cooler air over the water to rush in and fill the space. B. Cool air over the land rises, causing warmer air over the water to rush in and fill the space. C. Heat from the sun causes a convection current toward the land due to gravity. D. Warm air follows the tides and blows toward the land, forcing cooler air to rise above land. 6. Early in the afternoon, a weather station outside the school shows that the barometric pressure and temperature are both dropping rapidly. What type of weather do these readings indicate? A. Several days of clear, sunny weather B. Cool, cloudy weather with little chance of rain C. Thunderstorms later in the afternoon or evening D. Clearing weather today with rain likely tomorrow 7. What statement is true about the major jet stream winds of Earth? A. They blow from the east. B. The blow from the west. C. They blow from the north. D. They blow from the south. 8. The maps at the right show a front as it moves east across the United States. Which of these describes the weather change that can be expected for Amarillo, Texas? A. The cold front will bring cooler temperatures and snow. B. The cold front will bring cooler temperatures with thunderstorms and rain. C. The warm front will bring warmer temperatures with hot air for several days. D. The warm front will bring warmer temperatures with light rain for a few days. 9. The following map shows the location of a warm front on Wednesday during the summer. The air around the warm front is moist and is moving toward the New England area. What type of weather should the New England area expect on Thursday and Friday? A. Several days of light rain followed by warm, humid weather B. Several days of strong thunderstorms followed by hot, dry weather C. Fast-moving, strong thunderstorms followed by warm, humid weather D. No precipitation but a sudden change from cool weather to warm weather 10. A meteorologist is monitoring the weather around Capital City. She collects the following data from her weather instruments: • Air pressure dropping quickly • Warm air rising rapidly • Water droplets being pushed upward to the topmost part of a cumulonimbus cloud • Doppler radar map shows pockets of air with the wind blowing in opposite directions Based on the weather data, what should the meteorologist include in the weather forecast for the Capital City area? A. Increasing humidity with light rain B. Drop in air temperature with light snow C. Tornado watch with heavy rain and hail D. Approaching hurricane with heavy rain and strong winds 11. Meteorologists use relative humidity to express the water-vapor content of the air. The table shows the maximum amount of water vapor that can exist in the air at different temperatures. A. Air that is saturated will not change temperature easily. B. When saturated, warm air contains more water vapor than cold air. C. When saturated, cool air contains more water vapor than warm air. D. The temperature of air does not influence the amount of water it can contain. Temperature °C °F -10 0 5 10 15 20 25 14 32 41 50 59 68 77 Water Vapor Content at Saturation (g/kg) 2 3.5 5 7 10 14 20 12. Which of these describes how Earth’s orbit around the sun determines the seasons of Earth? A. Earth’s distance from the sun changes as it orbits the sun. B. Earth’s axis tilts in a different direction as Earth orbits the sun. C. Earth’s axis tilts different parts of Earth toward or away from the sun at different points in Earth’s orbit. D. Earth’s orbit around the sun brings different parts of Earth around to face warmer or cooler parts of the sun. 13. The following diagram shows the relative positions of Earth and the sun at a particular time of year. Which of these describes the length of day and night in the Northern and Southern Hemispheres at this time of year? A. Both hemispheres: Days are longer than nights. B. Both hemispheres: Days are shorter than nights. C. Northern Hemisphere: Days are shorter than nights. Southern Hemisphere: Days are longer than nights. D. Northern Hemisphere: Days are longer than nights. Southern Hemisphere: Days are shorter than nights. 14. During which season does sunlight strike the Northern Hemisphere as shown? A. Spring B. Summer C. Fall D. Winter 15. Tasha is studying polar and tropical climates on Earth. She learned the following: • Tropical climates: Summer and winter temperatures are similar. • Polar climates: Summer temperature is much higher than winter temperature. Tasha wonders why the tropical climate has the same temperature year round, but the polar climate temperature differs greatly. Which of these explains the reason for this difference? A. More clouds block direct sunlight from reaching the polar surface during the winter months. B. Most regions with subtropical climates are located near large bodies of water that make the climate more even. C. The subtropical regions have longer days and shorter nights than polar regions, so they receive more solar energy. D. The axis of Earth causes the polar regions to be tilted either toward or away from direct sunlight, depending on the time of year. 16. At a certain time of year, the Southern Hemisphere is tilted toward the sun. Which of these describes how this tilt affects the Southern Hemisphere during this time of year? A. The days will be longer in the Southern Hemisphere during this time of year. B. The nights will be longer in the Southern Hemisphere during this time of year. C. The seasons will be longer in the Southern Hemisphere during this time of year. D. The sun will rise lower in the sky in the Southern Hemisphere during this time of year. 17. The following diagram shows the relative positions of Earth and the sun during December’s winter solstice. On this day, how does the angle of Earth’s axis affect the number of daylight hours? A. All places on Earth experience the minimum number of daylight hours. B. Only places near the poles experience the minimum number of daylight hours. C. Only places in the Northern Hemisphere experience the fewest number of daylight hours. D. All places in the Northern Hemisphere experience the maximum number of daylight hours. 18. The following diagrams show the axis of Earth at its present 23° angle and at a perpendicular axis of 0°. How would seasons be affected if Earth’s axis were at a 0° angle? A. Earth would have no seasons. B. Seasonal variation would decrease at the poles. C. Seasonal variation would increase at the equator. D. Earth would have two seasons instead of four seasons. 19. Twice a year on Earth, the number of hours of darkness is equal to the number of hours of sunlight. These events, where both day and night are 12 hours, are the spring and autumn equinoxes. Which of these describes the orientation of the sun and Earth on these two days? A. Earth is located at its most distant point away from the sun. B. The tilt of Earth’s axis is neither toward nor away from the sun. C. The axes of the sun and Earth are pointed in the same direction. D. Earth is located at its closest point to the sun, and its axis is pointed away from the sun. 20. What would happen if the Earth’s rate of revolution were to decrease? A. The day would get longer. B. The year would get longer. C. The day would get shorter. D. The year would get shorter. Directions: Use the information below to answer questions 21 through 23. The National Oceanic and Atmospheric Administration (NOAA) can find hurricanes using satellite imagery. Researchers dropped sensors in the wall of a hurricane each day to determine the wind speed within the hurricane. The following shows the hurricane data and a weather map of Mississippi on September 28. Date Sept. 25 Sept. 26 Sept. 27 Sept. 28 Position Longitude (°W) Latitude (°N) 79.2 22.8 82.4 24.6 86.6 27.2 88.9 30.3 Category Wind Speed (MPH) Air Pressure Wind Speed (millibars) (miles per hour) 951 111 939 131 969 95 984 80 Damage Description Storm Surge (ft) No real damage to buildings. Damage to 21. The Saffir-Simpson 1 74 – 95 unanchored mobile homes. Some damage Hurricane Scale describes to poorly constructed signs. the type of damage caused Some damage to building roofs, doors, and 2 96 – 110 windows. Considerable damage to mobile by the wind speed of a homes. hurricane. Which of these Some structural damage to small homes describes the building 3 111 – 130 and buildings. Large trees blow down. Mobile homes and signs destroyed. damage that some areas of Some structural damage to the roofs on 4 131 – 155 Mississippi will experience small residences. from this hurricane based on Complete roof failure on many residences and industrial buildings. Some complete the hurricane data? building failures with small utility 5 156 and up A. No real damage to buildings blown over away. Flooding causes major damage to lower floors of all buildings. structures near the shore. B. Some damage to building roofs, doors, and windows. C. Some structural damage to the roofs on small residences. D. Complete roof failure on many residences and industrial buildings. 4–5 6–8 9 – 12 13 – 18 > 18 22. Based on the hurricane data, which of these is a cause-and-effect relationship of hurricane factors? A. An increase in air pressure causes the hurricane’s wind speed to decrease. B. A decrease in wind speed causes a decrease in the hurricane’s longitude. C. An increase in air pressure causes an increase in the hurricane’s wind speed. D. A decrease in the hurricane’s latitude causes the hurricane’s longitude to decrease. 23. Dee reviewed the data for this hurricane. She replicated the pressure system of the hurricane and its effect on wind speed. The following diagram shows her setup. Each time Dee pushed downward on the lever, the wind speed within the cylinder decreased. Dee concluded that the greater the air pressure within a hurricane, the lower the hurricane’s wind speed. Which of these is a logical defense for Dee’s conclusion? A. Her investigation proves that both high and low pressure systems create hurricanes. B. Her investigation supports the relationship between air pressure and wind speed found in the hurricane data. C. Her investigation proves that reducing wind speed within a hurricane will increase the air pressure of the hurricane. D. Her investigation supports the relationship between hurricane position and air pressure found in the hurricane data. 24. Like all winds in the Northern Hemisphere, as hurricane winds more northward, they curve to the east. This causes hurricanes to rotate in a counterclockwise fashion. Which of these explains why hurricane winds curve? A. Convection currents B. Coriolis effect C. Polar easterlies D. Trade winds 25. The following map shows the location of a hurricane in the Atlantic Ocean at 72°W longitude and 29°N latitude. The hurricane has been moving toward the northwest at a rate of 30 miles per hour. Which statement describes the likelihood of landfall of the hurricane? A. The trade winds will blow the hurricane to the Atlantic Coast. B. The warm ocean currents will carry the hurricane to the Yucatan Peninsula. C. The rotation of Earth will cause the hurricane to hit the land along the Gulf Coast. D. The cold arctic air will force the hurricane to the southeast area of the Atlantic Ocean. 26. The following map shows the movement of a hurricane in the Pacific Ocean. Based on the hurricane’s path, which of these describes the fate of this hurricane? A. It will make landfall on Alaska and weaken as it moves over the land. B. It will bounce off the Kamchatka Peninsula, spinning it down toward Japan. C. Cold arctic air around the Aleutian Islands will push the hurricane to move south toward the Hawaiian Islands. D. Cold arctic air around the Aleutian Islands will weaken the hurricane, and it will break apart before hitting landfall. 27. The following map shows the predicted range of location of a hurricane over a 3-day period and a 5-day period. What is likely to happen with the hurricane during the 4–5 day track? A. Hurricane force winds will hit Mississippi sometime Friday morning. B. Hurricane force winds will hit Mississippi sometime Wednesday evening. C. The hurricane will make landfall on Wednesday evening, losing energy as it moves north across Mississippi. D. The hurricane will become wider as it moves across Mississippi, so that by Friday it will cover the entire state. 28. The following map shows the predicted range of a hurricane’s location over a 3-day period and a 5-day period. Based on the information in the map, what is the likelihood that the hurricane will make landfall in southern Alabama? A. There is no chance because westerlies will push the hurricane to the southwest. B. There is a small chance because of possible changes in the hurricane’s path. C. Chances are good because another hurricane will deflect the hurricane into southern Alabama. D. There is no chance because the hurricane will make landfall in Florida and weaken significantly. 29. The following map shows the location of a hurricane in the Gulf of Mexico at 81° W and 17° N. Which of these describes the likely outcome for this hurricane? A. The rotation of Earth will force the hurricane to the southeast, where it will make landfall. B. The dry land surrounding the hurricane will absorb moisture from the hurricane, causing it to break apart. C. Strong trade winds will blow the hurricane across the Yucatan Peninsula toward Mexico, where it will make landfall. D. Strong ocean currents moving from the equator to the north will push the hurricane into Cuba, where it will break apart into many smaller storms. 30. Satellite observations of a hurricane in the middle of the Atlantic Ocean show that the hurricane is moving toward a large area of cool water. What does this observation indicate about the likelihood that the hurricane will strike land along the coast of the United States? A. The likelihood of a land strike is decreased because hurricanes that move over cool water lose intensity. B. The chance that the hurricane will strike land is increased because cool waters are located near the coast. C. The chance that the hurricane will strike land is decreased because the hurricane is located far from the coast. D. The likelihood of a land strike is increased because cold water tends to strengthen hurricanes and make them last longer.

