Predator – Prey Population changes over Time Generation # of Bear
advertisement
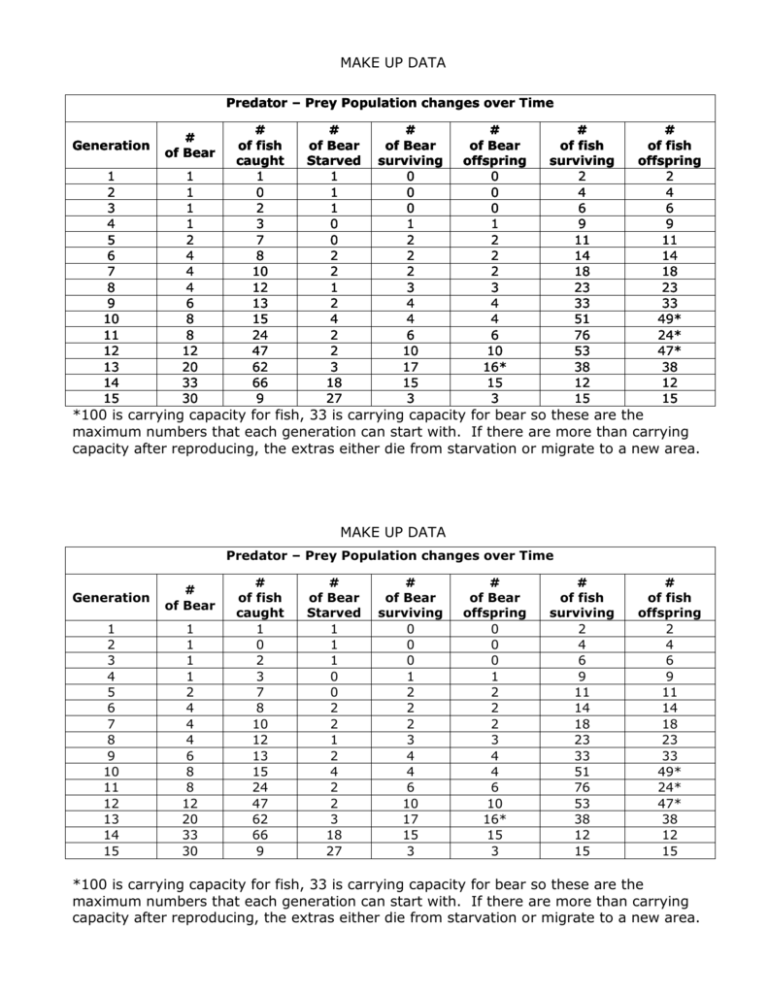
MAKE UP DATA Predator – Prey Population changes over Time Generation # of Bear 1 2 3 4 5 6 7 8 9 10 11 12 13 14 15 1 1 1 1 2 4 4 4 6 8 8 12 20 33 30 # of fish caught 1 0 2 3 7 8 10 12 13 15 24 47 62 66 9 # of Bear Starved 1 1 1 0 0 2 2 1 2 4 2 2 3 18 27 # of Bear surviving 0 0 0 1 2 2 2 3 4 4 6 10 17 15 3 # of Bear offspring 0 0 0 1 2 2 2 3 4 4 6 10 16* 15 3 # of fish surviving 2 4 6 9 11 14 18 23 33 51 76 53 38 12 15 # of fish offspring 2 4 6 9 11 14 18 23 33 49* 24* 47* 38 12 15 *100 is carrying capacity for fish, 33 is carrying capacity for bear so these are the maximum numbers that each generation can start with. If there are more than carrying capacity after reproducing, the extras either die from starvation or migrate to a new area. MAKE UP DATA Predator – Prey Population changes over Time Generation # of Bear 1 2 3 4 5 6 7 8 9 10 11 12 13 14 15 1 1 1 1 2 4 4 4 6 8 8 12 20 33 30 # of fish caught 1 0 2 3 7 8 10 12 13 15 24 47 62 66 9 # of Bear Starved 1 1 1 0 0 2 2 1 2 4 2 2 3 18 27 # of Bear surviving 0 0 0 1 2 2 2 3 4 4 6 10 17 15 3 # of Bear offspring 0 0 0 1 2 2 2 3 4 4 6 10 16* 15 3 # of fish surviving 2 4 6 9 11 14 18 23 33 51 76 53 38 12 15 # of fish offspring 2 4 6 9 11 14 18 23 33 49* 24* 47* 38 12 15 *100 is carrying capacity for fish, 33 is carrying capacity for bear so these are the maximum numbers that each generation can start with. If there are more than carrying capacity after reproducing, the extras either die from starvation or migrate to a new area.
