CHAP_12. Graph Coloring
advertisement
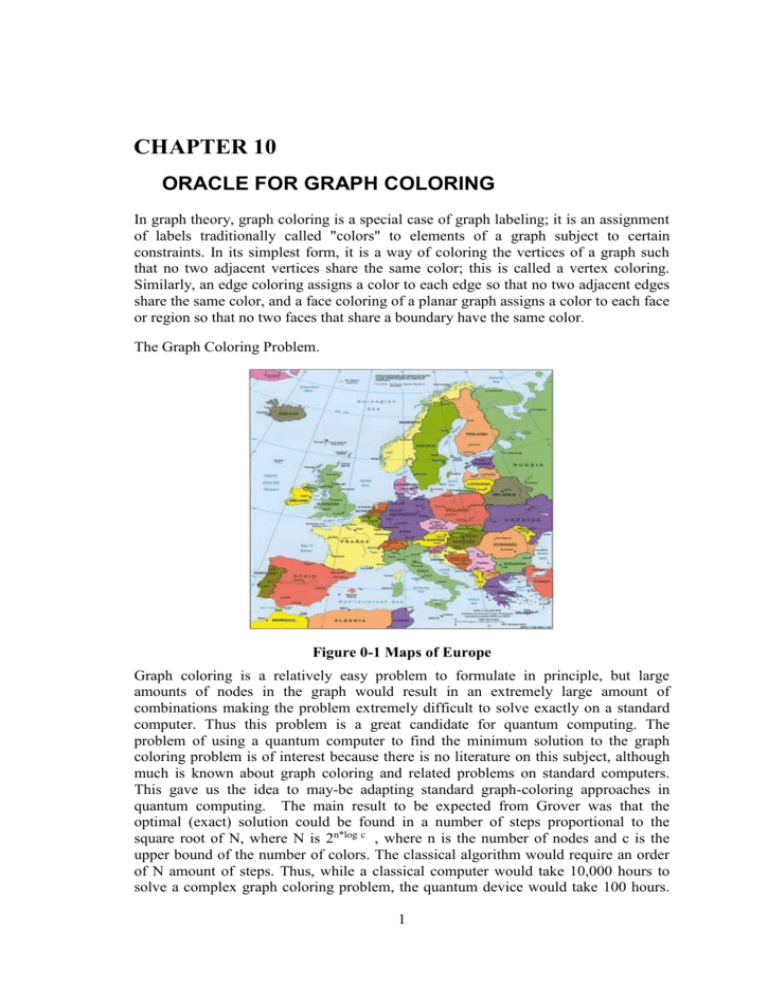
CHAPTER 10 ORACLE FOR GRAPH COLORING In graph theory, graph coloring is a special case of graph labeling; it is an assignment of labels traditionally called "colors" to elements of a graph subject to certain constraints. In its simplest form, it is a way of coloring the vertices of a graph such that no two adjacent vertices share the same color; this is called a vertex coloring. Similarly, an edge coloring assigns a color to each edge so that no two adjacent edges share the same color, and a face coloring of a planar graph assigns a color to each face or region so that no two faces that share a boundary have the same color. The Graph Coloring Problem. Figure 0-1 Maps of Europe Graph coloring is a relatively easy problem to formulate in principle, but large amounts of nodes in the graph would result in an extremely large amount of combinations making the problem extremely difficult to solve exactly on a standard computer. Thus this problem is a great candidate for quantum computing. The problem of using a quantum computer to find the minimum solution to the graph coloring problem is of interest because there is no literature on this subject, although much is known about graph coloring and related problems on standard computers. This gave us the idea to may-be adapting standard graph-coloring approaches in quantum computing. The main result to be expected from Grover was that the optimal (exact) solution could be found in a number of steps proportional to the square root of N, where N is 2n*log c , where n is the number of nodes and c is the upper bound of the number of colors. The classical algorithm would require an order of N amount of steps. Thus, while a classical computer would take 10,000 hours to solve a complex graph coloring problem, the quantum device would take 100 hours. 1 The relative speedup of quantum computing is only quadratic in this case, but in any case it is dramatic in real-life situations like military image recognition. For instance; South Korea installed robots soldiers on its frontier with North Korea that are equipped with image recognition abilities. In this case the quadratic speedup is very important, 5 seconds versus 25 seconds may make a life-or-death difference. There are many other problem instances like this. In the simplest formulation of graph coloring, a graph is denoted as a standard graph (not a multi-graph) with a certain number of edges and nodes. Every node is connected to at least one other node, by means of an edge. Every node may also obtain a color, which is represented as a bit string. A solution to a graph coloring problem consists of having no uncolored nodes, and having no edges connecting 2 nodes of the same color. We want also to minimize the number of colors used (this leads to finding the chromatic number of the graph). A rather popular branch of graph coloring is called “Map Coloring”. Maps, for easy distinction between countries in them, tend to have different, adjacent countries colored differently. For those whose eyesight is not perfect, the distinction between 2 shapes of different colors is far more easily recognized than a thin black borderline. In graph coloring, each country is represented as a node, and borders are represented as graph edges, (see Figure 9.1). The interest in Map Coloring was started by Francis Guthrie, who in the 1850’s formulated a problem involving coloring a map with only 4 colors. The problem remained unsolved until 1976, when after hundreds of computer-hours of calculation, Kenneth Appel and Wolfgang Haken proposed a solution that, as of yet, has not been disproven and mathematicians agree that the solution is correct. Map coloring is thus the first and easy variant of graph coloring and constraint satisfaction problems that we explain and simulate in this thesis. Since it was proved that every map can be colored with 4 colors, my oracle is greatly simplified, especially if one would try to apply it to a very big map. 1.1 Proposed Architecture for Graph Coloring Problem using Grover’s Algorithm In this section, we introduce the proposed architecture for finding the minimum coloring using Grover Algorithm. 2 All good coloring are encoded by negative phase Vectors of Basic States Vectors of Hadamards Oracles With Comparator And Global AND Think this as to be very big K-map With -1 for every good coloring Work bits Figure 0-2. superposed quantum states with negative phase for all good colorings of a map Figure 0-2 shows Error! Reference source not found.Block Diagram of creating superposed quantum states with negative phase for all good colorings of a map. Observe that information if a given coloring is good is seen by the output of AND in oracle, but the argument for which the oracle is satisfied is shown in negative phase of the respective minterm of the color encoding variables. It gives the idea of using Grover for graph coloring. Nodes(countries) are represented as groups of neighbor input variables. Coloring of a node is represented as a binary encoding of the set of qubits corresponding to this node. All possible colorings are created at the oracle’s inputs by the vector of Hadamard gates on each input. As always, they are all initialized to state 0 . Figure 0-3gives the example of coloring a particular map (left top corner) with inequality comparators and a global AND. The global AND produces a logic one when all neighbor nodes have different nodes. Observe that although the graph is 3colorable, a coloring with 4 colors is given here as a good coloring because this simple oracle is not trying to minimize the number of colors used for the coloring i.e., (this is a Decision Oracle, not an Optimization Oracle). The first solution out of many can terminate if the standard Grover algorithm is run. This figure shows also that all primary inputs are repeated to the outputs and forwarded to the next stages together with the output bit(yes/no) of the oracle. The details of Hadamard gates and their initializations are presented in Figure 0-3. 3 1 3 2 We need to give all possible colors here 4 Two wires for color of node 1 Two wires for color of node 2 Two wires for color of node 3 Two wires for color of node 4 Gives “1” when nodes 1 and 2 have different colors 12 13 23 24 34 Value 1 for good coloring Figure 0-3 A simple graph coloring problem: the color comparators correspond to the borders of the countries or the edges of the graph. Observe that this oracle can be used not only in quantum but also in reversible and classical technologies, but in such cases it would require sequential inputs and not parallel superposed inputs as created by Hadamard gates in quantum oracles The blocks for the complete Oracle for Graph Coloring and how they are connected together are illustrated in Figure 0-4. This oracle is quantum due to the fact that it is comprised solely of quantum gates. Thus all the gates from Figure 9.2.3 are replaced with their quantum counterparts, as discussed in Chapter 11, with all gates build from quantum primitives as discussed in chapters 2 and 3. Counter of number of ones Sorter/ Absorber inputs C C AND Desired number of colors Compar ator AND Output Figure 0-4 Simplified schematic of my optimization Graph Coloring Oracle The rough explanation of blocks from Figure 0-4 Simplified schematic of my optimization Graph Coloring OracleFigure 0-4 is as follows. 1.1.1 The C blocks: These are the Inequality Comparators. As we know, they act upon sets of two inputs. Those two inputs are representative of connected nodes’ color encoding. If these two inputs binary strings are the same, then they violated coloring rule and output of the C block will be “0”. The quantum oracle is to run through every possible color 4 configuration of inputs (see Figure 0-3 Figure 0-3and Figure 0-4); only a few are solutions. In order to determine whether it is a solution, we run the representative inputs through the comparators. The C comparators outputs are then forwarded into an AND gate at the bottom left to determine whether the configuration is a solution. 1.1.2 The Sorter/Absorber: Here, the inputted color encodings are sorted. If two inputs are the same for different nodes (same color used more than once), then only one will be outputted and all other same input will be “absorbed” (removed). This circuit sorts and absorbs colors such that all inputs will be sorted from the “smallest” to the “largest” and each color only has one output. We can observe that this is a general circuit to convert a list of items with repetitions to a set with no repeated elements. The entire circuit is very big and it is difficult to put it on paper. Here we give only some of the blocks and we do not show the complete layout that includes CNOT gates for copying and SWAP gates to be able to combine all blocks together. a0 a1 x b0 b1 y c0 c1 z d0 d1 v Sorter/ Absorber Processor Tag bits for sorting and absorbing Figure 0-5 Sorter/Absorber 1.2 Graph Coloring Oracle The graph coloring oracle defines the minimum number of colors needed to color the edges of a graph. The graph we are using is a planar graph. The proposed architecture for the graph coloring oracle is as follows. 5 Figure 0-6 Architecture of graph coloring oracle Two wires have been assigned for each edge and the comparator compares the colors of two edges at a time and finally all the outputs are given to a AND gate to check if the result is good or bad. 1.3 Exercising the oracle using a counter 6 Figure 0-7 Exercising the oracles using a counter A 32 – bit counter has been used in order to generate the colors for the edges. From this 32-bit value 16 bits are taken for one edge and 16 bits for another edge. 1.4 How does the sorter work? The sorting is implemented by recursively running the above process of comparison for number of times by using the following butterfly pattern. Figure 0-8 Sorter using butterfly pattern Observe in Figure 0-8 Sorter using butterfly pattern that the continuous recursion of the comparator logic finally gave a sorted result and also the number of times the pattern must be repeated is equal to number of colors that are present in the graph. 7 1.5 Implementation of the oracle in Verilog Since we need to find the amount of time it takes for the hardware to run this process and a simulator to do the same work we have increase the number of comparisons as the process speed depends only this comparisons. So a large number of random values are generated and are fed to the comparator and allowed to run run for a large number of clock cycles. Verilog module for comparator Module graph_comparator(input [15:0] data_inA,data_inB, input Min_val,Max_val); begin always@(posedge clk) begin/*Start the sequiential logic block for comparison and sorting*/ if (data_inA == 0 || data_inB == 0) begin if(data_inA == 0) begin Max_val = 0; Min_val = data_inB; end else begin Max_val = 0; Min_val = data_inA; end end else if (data_inA == data_inB) begin Max_val = 0; Min_val = data_inA; end else begin if(data_inA > data_inB) begin Min_val = data_inB; Max_val = data_inA; end else begin Min_val = data_inA; Max_val = data_inB; end end end/*End of the sequiential logic block for comparison and sorting*/ end endmodule 8 clk, output reg [15:0]
