S6 Table. Abiotic and Biotic Variables Influencing Ranavirosis
advertisement
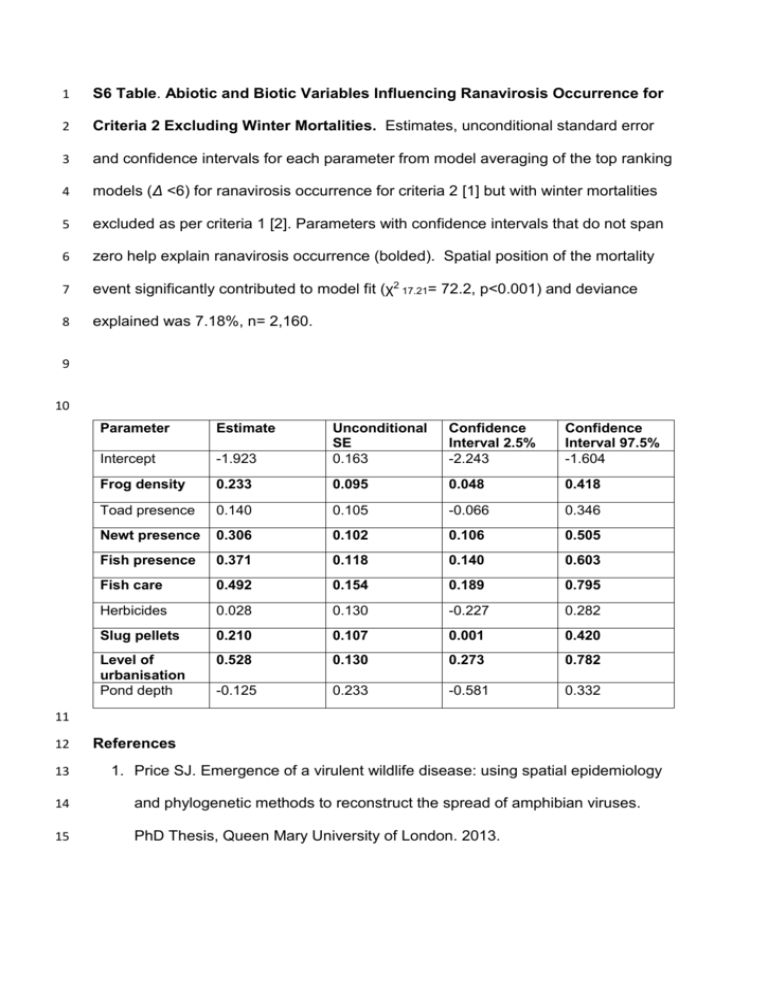
1 S6 Table. Abiotic and Biotic Variables Influencing Ranavirosis Occurrence for 2 Criteria 2 Excluding Winter Mortalities. Estimates, unconditional standard error 3 and confidence intervals for each parameter from model averaging of the top ranking 4 models (Δ <6) for ranavirosis occurrence for criteria 2 [1] but with winter mortalities 5 excluded as per criteria 1 [2]. Parameters with confidence intervals that do not span 6 zero help explain ranavirosis occurrence (bolded). Spatial position of the mortality 7 event significantly contributed to model fit (χ2 17.21= 72.2, p<0.001) and deviance 8 explained was 7.18%, n= 2,160. 9 10 Parameter Estimate -1.923 Unconditional SE 0.163 Confidence Interval 2.5% -2.243 Confidence Interval 97.5% -1.604 Intercept Frog density 0.233 0.095 0.048 0.418 Toad presence 0.140 0.105 -0.066 0.346 Newt presence 0.306 0.102 0.106 0.505 Fish presence 0.371 0.118 0.140 0.603 Fish care 0.492 0.154 0.189 0.795 Herbicides 0.028 0.130 -0.227 0.282 Slug pellets 0.210 0.107 0.001 0.420 Level of urbanisation Pond depth 0.528 0.130 0.273 0.782 -0.125 0.233 -0.581 0.332 11 12 References 13 1. Price SJ. Emergence of a virulent wildlife disease: using spatial epidemiology 14 and phylogenetic methods to reconstruct the spread of amphibian viruses. 15 PhD Thesis, Queen Mary University of London. 2013. 16 2. Teacher AGF, Cunningham AA, Garner TWJ. Assessing the long-term impact 17 of Ranavirus infection in wild common frog populations. Anim Conserv. 18 2010;13: 514-522. 19
