optional
advertisement
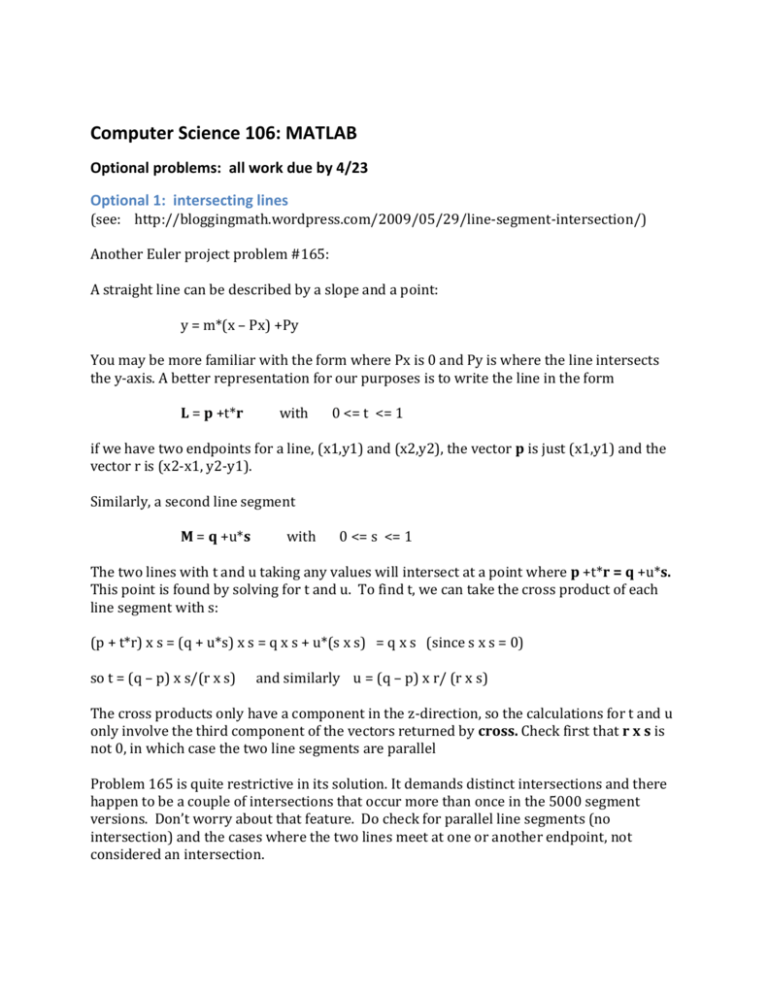
Computer Science 106: MATLAB Optional problems: all work due by 4/23 Optional 1: intersecting lines (see: http://bloggingmath.wordpress.com/2009/05/29/line-segment-intersection/) Another Euler project problem #165: A straight line can be described by a slope and a point: y = m*(x – Px) +Py You may be more familiar with the form where Px is 0 and Py is where the line intersects the y-axis. A better representation for our purposes is to write the line in the form L = p +t*r with 0 <= t <= 1 if we have two endpoints for a line, (x1,y1) and (x2,y2), the vector p is just (x1,y1) and the vector r is (x2-x1, y2-y1). Similarly, a second line segment M = q +u*s with 0 <= s <= 1 The two lines with t and u taking any values will intersect at a point where p +t*r = q +u*s. This point is found by solving for t and u. To find t, we can take the cross product of each line segment with s: (p + t*r) x s = (q + u*s) x s = q x s + u*(s x s) = q x s (since s x s = 0) so t = (q – p) x s/(r x s) and similarly u = (q – p) x r/ (r x s) The cross products only have a component in the z-direction, so the calculations for t and u only involve the third component of the vectors returned by cross. Check first that r x s is not 0, in which case the two line segments are parallel Problem 165 is quite restrictive in its solution. It demands distinct intersections and there happen to be a couple of intersections that occur more than once in the 5000 segment versions. Don’t worry about that feature. Do check for parallel line segments (no intersection) and the cases where the two lines meet at one or another endpoint, not considered an intersection. To solve this problem for, you will need to look at every line segment and compare it to every other line segment, i.e. use two loops. Write the two loops so you compare every line with every other but only once and not with itself? The calculation is slow, so just run it on 500 line segments. Your answer should be on the order of 15,000 intersections. Generating the line segments Project Euler uses line segments generated by these formulas that create sequential values of t: s0 = 290797 sn+1 = sn sn (modulo 50515093) tn = sn (modulo 500) So, set s to an initial value and compute the next value of s as the formula indicates: s = mod(s*s, 50515093) t= … repeat this to generate all of the t values you need (2000 if you are using just 500 points). Once you have a set of t values, reshape them into a matrix of 500 rows by 4 columns, each column containing the points x1, y1 and x2,y2 You can speed up the calculation a bit if you compute all of the 500 vectors p and r (including the 0 z-component) for each line segment and storing them. Optional 2: A second extra credit program: Take the rabbits and foxes model from the online lecture notes. Add a yearly hunting season on rabbits every 12th month (can use the mod function!), subtracting some fraction of rabbits. Do the subtraction after all of the rest of the calculation for that month is complete. Examine the effect of hunting for 10%, 20%, and 30% mortality of rabbits. What is the impact of the hunting? Optional 3: create a GUI program Take one of your earlier programs and create a GUI for it. Examples might be plotting a chosen Legendre polynomial (user choice), creating an epidemic model where user varies parameters, an interactive wind chill calculator.


