Supplementary Materials Increasing Dissolved Nitrogen and
advertisement
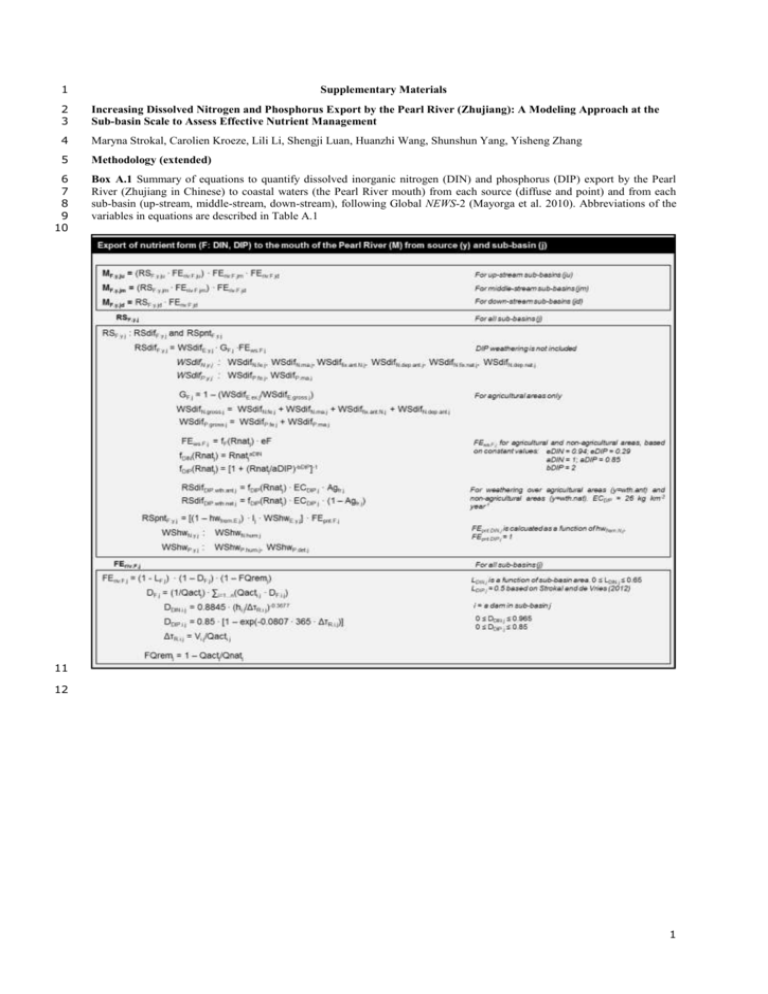
1 Supplementary Materials 2 3 Increasing Dissolved Nitrogen and Phosphorus Export by the Pearl River (Zhujiang): A Modeling Approach at the Sub-basin Scale to Assess Effective Nutrient Management 4 Maryna Strokal, Carolien Kroeze, Lili Li, Shengji Luan, Huanzhi Wang, Shunshun Yang, Yisheng Zhang 5 Methodology (extended) 6 7 8 9 10 Box A.1 Summary of equations to quantify dissolved inorganic nitrogen (DIN) and phosphorus (DIP) export by the Pearl River (Zhujiang in Chinese) to coastal waters (the Pearl River mouth) from each source (diffuse and point) and from each sub-basin (up-stream, middle-stream, down-stream), following Global NEWS-2 (Mayorga et al. 2010). Abbreviations of the variables in equations are described in Table A.1 11 12 1 13 14 15 Table A.1 Abbreviations of the equations in Box A.1 used to quantify dissolved inorganic N (DIN) and phosphorus (DIP) export by the Pearl River from each source (diffuse and point) and from each sub-basin (up-stream, middle-stream, downstream) Abbreviation Description Unit MF.y.ju, MF.y.jm, MF.y.jd Export of nutrient form (F: DIN, DIP) to the mouth of the Pearl River (M) from source y and from upstream (ju), middle-stream (jm) and down-stream (jd) sub-basins (j) kg year-1 RSF.y.j Nutrient inputs (F: DIN, DIP) to the river system (RS) from source y in sub-basin j kg year-1 RSdifF.y.j Nutrient inputs to the river system (RS) from diffuse (dif) source y in sub-basin j kg year-1 WSdifE.y.j Inputs of nutrient element (E: N, P) to land from diffuse source y in sub-basin j kg year-1 WSdifN(P).fe.j Use of synthetic N (or P) fertilizer kg year-1 WSdifN (P).ma.j Use of N (or P) animal manure kg year-1 WSdifN.fix.ant.j Biological N2-fixation by agricultural crops kg year-1 WSdifN.fix.nat.j Biological N2-fixation by natural vegetation kg year-1 WSdifN.dep.ant.j Atmospheric N-deposition on agricultural areas kg year-1 WSdifN.dep.nat.j Atmospheric N-deposition on non-agricultural areas kg year-1 GF.j The fraction of land-surface diffuse F (F: DIN, DIP) sources remaining after animal grazing and crop harvesting in sub-basin j 0-1 WSdifE.ex.j Export of nutrient element (E: N, P) by animal grazing and crop harvesting in sub-basin j kg year-1 WSdifE.gross.j Inputs of nutrient element (E: N, P) to agricultural land from all diffuse sources of sub-basin j kg year-1 FEws.F.j The fraction of nutrient form (F: DIN, DIP) that is exported from land to the river of sub-basin j 0-1 fF(Rnatj) Calculated function of mean annual runoff from land to streams of sub-basin j - Rnatj Mean annual (natural) runoff from land to streams of sub-basin j m year-1 eF The constant that considers export of nutrient form (F: DIN, DIP) from land to the river - aDIN, aDIP, bDIP The constant values used to calculate the function of mean annual runoff - RSdifDIP.wth.ant.j Inputs of DIP to the river system of sub-basin j from weathering of P-contained minerals in agricultural areas kg year-1 RSdifDIP.wth.ant.j Inputs of DIP to the river system of sub-basin j from weathering of P-contained minerals in nonagricultural areas kg year-1 ECDIP.j The coefficient of P weathering, assumed to be 26 in kg km-2 year-1, calculated for each subbasin j by multiplying with sub-basin area kg year-1 Agfr.j The fractions of agricultural areas in sub-basin j. Agricultural areas include grassland in pastoral systems (e.g., dominated by grazing, limited manure storage and application), grassland in mixed systems (e.g., areas close to rivers, manure storage and application can take place), wetland rice, legumes (e.g., soybean and pulses) and cropland (e.g., maize, cereals) 0-1 (1 – Agfr.j) The fractions of non-agricultural areas in sub-basin j 0-1 RSpntF.y.j Nutrient inputs to the river system (RS) from point (pnt) source y in sub-basin j kg year-1 hwfrem.E.j The fraction of nutrient element (E: N, P) removed during wastewater treatment in sewage facilities of sub-basin j 0-1 Ij The fraction of population connected to sewage facilities 0-1 WShwE.y.j The amount of nutrient element (E: N, P) generated in human waste (source y) and detergents (source y) in watersheds (land) of sub-basin j kg year-1 WShwN.hum.j The amount of N element generated in human waste in watersheds (land) of the sub-basin j kg year-1 WShwP.hum.j The amount of P element generated in human waste in watersheds (land) of the sub-basin j kg year-1 WShwP.det.j The amount of P element generated in detergents in watersheds (land) of the sub-basin j kg year-1 FEpnt.F.j The fraction of nutrient element in sewage effluents that is emitted to the river of sub-basin j as a form (F: DIN, DIP) 0-1 FEriv.F.j The fraction of nutrient (F: DIN, DIP) inputs to the river of sub-basin j that are exported at the outlet of sub-basin j 0-1 LDIN.j The fraction of DIN retained / lost in the river of sub-basin j (e.g. denitrification processes) 0-1 LDIP.j The fraction of DIP retained / lost in the river of sub-basin j (e.g. sediment-water retention processes) 0-1 DF.j The fraction of nutrient form (F: DIN, DIP) retained in dammed reservoirs of sub-basin j 0-1 DDIN.i.j The fraction of DIN retained in dammed reservoir i of sub-basin j 0-1 DDIP.i.j The fraction of DIP retained in dammed reservoir i of sub-basin j 0-1 ΔτR.i.j Water residence time of dammed reservoir i in sub-basin j Years Vi.j Volume of dammed reservoir i in sub-basin j km3 hi.j Average depth of reservoir i in sub-basin j meter Qacti.j Actual water discharge (after water is removed for consumption purposes) of dammed reservoir i in sub-basin j km3 year-1 2 16 17 18 19 20 21 FQremj The fraction of nutrients (general for DIN and DIP) removed from the river system by water consumption for different purposes (e.g. irrigation, hydropower) 0-1 Qactj Actual (after water consumption) water discharge at the outlet of sub-basin j km3 year-1 Qnatj Natural (before water consumption) water discharge at the outlet of sub-basin j km3 year-1 Table A.2 Descriptions of deriving inputs for model variables/parameters to quantify dissolved inorganic nitrogen (DIN) and phosphorus (DIP) export by the Pearl River (Zhujiang in Chinese) to coastal waters at the sub-basin scale. Box A.1 and Table A.1 describe abbreviations. Variable / parameter Description (D) Total area D1 For diffuse sources: Agricultural area (Agfr.j) Watershed diffuse sources (WSdifE.y.j) and watershed export (WSdifE.ex.j) Watershed export constant (eF) Diffuse export coefficient (ECDIP.j) D2 D3 D4 D5 For point sources: Watershed point sources (WSpntE.y.j) Nutrient removal during sewage treatment (hwfrem.E.j) Total population and population with sewage connection (Ij) D6 D7 D8 For hydrology and reservoir retentions: Runoff (Rnatj), actual (Qactj) and natural (Qnatj) water discharges Data for each reservoir/dam: volume (Vi.j), depth (hi.j) and water discharge (Qacti.j) Retention in reservoirs (DF.j) Retention in the river (LF.j) Runoff shape constants (aF, bF) Description (D): D9 D10 D11 D12 D13 Ds 1-4, 6, 8, 9 - Inputs for these parameters/variables were aggregated from 0.5 by 0.5 degree cell to a sub-basin scale using ArcGIS functions. Gridded inputs prepared by Fekete et al. (2010) for variables associated with hydrology and reservoirs, Bouwman et al. (2009) for variables associated with diffuse sources and by Van Drecht et al. (2009) for variables associated with point sources. These inputs are available for 1970, 2000, 2050. D1 – The total area of each sub-basin (km2) calculated using areas of cells (raster map of 0.5x0.5 degree, area of each cell in km2) covering this sub-basin. D2 – The fraction of agricultural area for a sub-basin (Agfr.j, 0-1) is calculated: (the sum of sub-basin cells with agricultural areas (each cell has agricultural area in percentage) divided by the number of cells in this sub-basin) / 100. We used “mean function” of Zonal Statistics in ArcGIS. D3 – N and P inputs to watersheds (land) of each sub-basin from diffuse sources (WSdifE.y.j, kg year-1 for each sub-basin) were calculated using N and P diffuse inputs on a 0.5 by 0.5 degree cell (raster map, nutrient inputs in kg ha -1 in each cell) and area land of cells (raster map of 0.5x0.5 degree cell, km2) in three steps in ArcGIS. The first step is to convert values from kg N(P) ha -1 of each grid cell to kg N(P) km-2 of each grid cell using “Spatial Analyst Tools” in ArcGIS. The second step is to calculate kg N(P) per grid cell by multiplying values of the first step by area land (km 2) of each cell (raster map of 0.5x0.5) degree using “Spatial Analyst Tools”. The third step is to calculate kg N(P) per sub-basin by summing outputs of the second step with the total area of subbasin cells (km2) (sub-basin polygon map was created based on STN-30 and used in this step) using “Zonal Statistics” in ArcGIS. Diffuse sources of N and P inputs to watersheds (WSdifE.y.j) include animal manure and synthetic fertilizers for N and P; atmospheric N-deposition on agricultural (for crop and livestock production) and non-agricultural areas, and biological N2-fixation by agricultural crops and by natural vegetation for N. N and P export from watersheds (WSdifE.ex.j, represents animal grazing and crop harvesting) is calculated similar to diffuse sources (3 steps above). D4 – Watershed export constant (eF) was taken directly from Global NEWS-2 (Mayorga et al. 2010). This is a basin scale constant and thus it is the same for all sub-basins and it does not vary among years. D5 – Diffuse export coefficient (ECDIP.j) was taken directly from Global NEWS-2 (Mayorga et al. 2010). This is a basin scale coefficient and thus it is the same for all sub-basins and it does not vary among years. D6 – Production of N and P inputs in watersheds (land) of each sub-basin from point sources (WSpntE.y.j, kg year-1 for each sub-basin) were back calculated for 2000 except for the Beijiang sub-basin: WSpntE.y.j = RSpntE.y.j / [(1- hwfrem.E.j) ∙ Ij], where RSpntE.y.j - nutrient inputs to the river system as element (E: N, P, kg year-1) for each sub-basin; hwfrem.E.j - nutrient removal (fraction, 0-1) during sewage treatment for each sub-basin (see D7); Ij - the fraction of population connected to sewage systems in each sub-basin (0-1) (see D8). RSpntE.y.j for each sub-basin was calculated using N and P inputs to the river system on a gridded scale of 0.5 by 0.5 degree cell (raster map, nutrient inputs in kg km -2 in each cell). Calculations were done similarly to diffuse sources (see steps 2 and 3 of D3). Point sources of N and P include (WSpntE.y.j) human waste for N and P and detergents for P. For the Beijiang sub-basin for 2000 we calculated WSpntE.y.j using values for the Zhujiang basin from Global NEWS-2 (Mayorga et al. 2010). This basin covers the Yujiang, Liujiang, Xijiang, Beijiang and Zhujiang delta sub-basins in our study. This Zhujaing basin was delineated in Global NEWS-2 using the same simulation topological network (STN-30) as we use in our study (Vörösmarty et al. 2000). We calculated WSpntE.y.j for the Beijiang as follows: WSpntE.y.j for Zhujiang basin from Global NEWS-2 (kg year-1) minus the sum of WSpntE.y.j values for the Yujiang, Liujiang, Xijiang, and Zhujiang delta subbasins from our study (kg year-1). For each sub-basin (except for the Dongjiang) for 1970 WSpntE.y.j was calculated as: the fraction of a sub-basin multiplied by the WSpntE.y.j value for the Zhujiang basin from Global NEWS-2. The fraction of a sub-basin was calculated based on WSpntE.y.j values for 2000: WSpntE.y.j for this sub-basin in 2000 (kg year-1) divided by WSpntE.y.j value for the Zhujiang basin from Global NEWS-2 in 2000 (kg year-1). For the Dongjiang sub-basin for 1970 and 2050 we followed the approach described above for 2000 (back calculations). D7 - Nutrient removal during sewage treatment (hwfrem.E.j, fraction, 0-1) was taken directly from Global NEWS-2 (Mayorga et al. 2010) for the Zhujinag River for 1970, 2000 and 2050. The Zujiang River covers five sub-basins in our study: the Yujiang, Liujiang, Xijiang, Beijiang and Zhujiang delta. Nutrient removal is the same for these sub-basins. For the Dongjiang sub-basin, nutrient removal was taken from Global NEWS-2 (Mayorga et al. 2010) for 1970. For 2000 and 2050 nutrient removal is 0.80 for N and P in 2000, and 0.80 for N and 0.90 for P in 2050. Assumptions are based on expert knowledge regarding the current economic development in the Dongjiang sub-basin. D8 – Total population (inh year-1) and population with a sewage connection (Ij, inh year-1) for each sub-basin were calculated using population density (inh km-2 year-1 in each grid cell) and population density with a sewage connection (inh km-2 year-1 in each grid cell). Calculations were performed in ArcGIS similarly to diffuse sources (see steps 2 and 3 of D3). In this study we use the fraction of population connected to sewage systems, which is population with a sewage connection (inh year-1 in each sub-basin) divided by the total population (inh year-1 in each sub-basin). D9 – Runoff (Rnatj, m year-1) and water discharges (Qactj, Qnatj, km3 year-1) per sub-basin were calculated in several steps. First, water discharges (m3 s-1) were taken from a grid cell, which represents the outlet of the sub-basin. For the middle-stream sub-basins these water discharges account for water discharges from up-stream sub-basins. For down-stream sub-basins these water discharges account for water discharges from both up-stream and middle- 3 stream sub-basins. Therefore we subtracted up-stream water discharge from middle-stream water discharge to calculate water discharge for middle-stream sub-basins. We did the same for down-stream sub-basins. Fig. 1 in the article shows the locations of the sub-basins their outlets. Then, we converted values from m3 s-1 to km3 year-1. Finally, we quantified runoff for each sub-basin: natural water discharge (Qnatj, km3 year-1) divided by the total area of the subbasin (km2) (and multiplied by 1000 to get m year-1). D10 – Inputs for volume (Vi.j, km3), depth (hi.j, meters) and water discharge (Qacti.j, km3 year-1) for individual reservoirs in the sub-basins were taken directly from the Global Reservoir and Dam database (GRanD) (Lehner et al. 2011a; Lehner et al. 2011b). D11 – Nutrient (DF.j) retentions in all reservoirs of each sub-basin were averaged over the sub-basin using actual water discharge (Qactj, km3 year-1) at the outlet of the sub-basin (see D9, Box A.1 and Table A.1). Maximum value is 0.965 for DIN and 0.85 for DIP according to Mayorga et al. (2010). If calculated values exceed the maximum value, then maximum value is assigned. D12 – Retention in the river of a sub-basin (LF.j, fraction 0-1) is calculated as a function of sub-basin area (Box A.1) for DIN. Here maximum value is 0.65 according to Global NEWS-2 (Mayorga et al. 2010). If this value exceeds the maximum value, then maximum value is assigned. For DIP we assumed the fraction of DIP retention in rivers (e.g. via water-sediment processes) 0.50 based on Strokal and de Vries (2012). D13 - Runoff shape constants (aF, bF) were taken directly from Global NEWS-2 (Mayorga et al. 2010). These are assumed the same for all sub-basins and years. 22 23 24 Table A.3. Modeled versus observed dissolved inorganic nitrogen (DIN) and phosphorus (DIP) export by the Pearl River at the sub-basin scale (kg km-2 year-1). River mouth / outlets The Pearl River mouth Nutrient form DIN Modeled 429* DIP 10* DIN 2011 DIP The Xijiang outlet The Yujiang outlet The Dongjiang outlet 25 26 27 28 29 30 31 32 33 34 35 36 37 38 24 Observed** 523 942 (602-1148) 837 866 770 823 19 (6.3-29) 17 29 12 13 1910-2864 1876 438 46 Source Meybeck and Ragu (1995) Liu et al. (2009) Zhang (1996) Zhang (2002) Zhang et al. (1999) Lu et al. (2009) Liu et al. (2009) Zhang (1996) Zhang (2002) Zhang et al. (1999) Lu et al. (2009) Ho and Hui (2001) Zhou et al. (2012) Wu and Chen (2013) Wu and Chen (2013) NH4-N 58*** 78 (41-108) NH4-N 69*** 47 (4-87) The Ministry of Environmental Protection of the People’s Republic of China The Ministry of Environmental Protection of the People’s Republic of China * River export of DIN and DIP including inputs from six sub-basins (see section 2.2.1). **Observed fluxes of DIN and DIP (kg km-2 year-1) were calculated from concentrations of these nutrients (mg N or P L-1) using observed water discharge and (sub)basin area when available (see Table A.3). If observed water discharges and areas are not available values from Mayorga et al. (2010) were used. Minimum and maximum values are given in parentheses (if available). ***We assumed that 15% of modeled DIN export is as NH4-N based on Meybeck (1982). Based on this assumption we calculated modeled NH4-N fluxes for the Xijiang and Yujiang sub-basins. Table A.4. The drainage basin area (km2), annual water discharge (km3 year-1) and concentrations of dissolved inorganic N (DIN) and phosphorus (DIP) in the Pearl River mouth, and in Dongjiang, Xijiang and Yujiang outlets (mg N or P L-1) according to literature sources Sources Area Water discharge The Pearl river mouth Meybeck and Ragu (1995)a Liu et al. (2009)b Zhang (1996)c Zhang (2002)d Zhang et al. (1999)e Lu et al. (2009)f 437000 590000 442585 590000 454000 The Dongjiang outlet Ho and Hui (2001)g Zhou et al. (2012)h Wu and Chen (2013)i Concentrations* DIN DIP 363 482 316 482 350 280 0.63 1.15 (0.75-1.41) 1.17 1.06 0.97 1.59 0.023 (0.008-0.036) 0.023 0.036 0.015 0.022 35340 25325 37.5 23.3 1.75 1.77 0.48 - The Xijiang outlet The Ministry of Environmental Protection of the People’s Republic of Chinaj - - 0.24 (0.13-0.34) - The Yujiang outlet The Ministry of Environmental Protection of the People’s Republic of Chinaj - - 0.22 (0.02-0.41) - 0.05 * Some studies reported concentrations of the nutrients in µM. Thus, we converted concentrations from µM to mg N or P L-1 using molecular weights of NO2, NO3, NH4, PO43-. a – GEMS/GLORI database: annual average concentrations of NO3, NH4 (as DIN here) and PO43- (as DIP here) near the river mouth. b – Average values of NO2, NO3, NH4 (as DIN here) and PO43- (as DIP here) for 1999 (August) and 2000 (January) were given together with minimum and maximum their values. 4 39 40 41 42 43 44 45 46 47 48 49 50 51 52 53 54 55 56 57 58 59 60 61 62 63 64 65 66 67 c – Measurements of NO2, NO3, NH4 (as DIN here) and PO43- (as DIP here). This study reported these measurements that were taken from earlier studies such as Zhang et al. (1994), where data were collected from 8 expeditions between July 1980 and August 1987. d – Averaged measurements over 1980-1990s (covering dry and wet seasons) for NO2, NO3, NH4 (as DIN here) and PO43- (as DIP here). e – Measurements of NO3, NH4 (as DIN here) and PO43- (as DIP here) given for the period of 1996-1997. Data were collected from two cruises (each cruise was about 16 days) conducted during this period. These cruises covered wet (August–September, 1996) and dry (January–February, 1997) periods. f – Annual average concentrations of the nutrients over eight sampling points in the estuary of the Pearl River during the period of 2005-2006. Water sampling was done monthly starting from March 2005 until February 2006. DIN includes NO2, NO3, NH4.. g – Averaged values of NH4-N with 3-month intervals during 1996 and 1998 at Yantian (name of the residential district) that is close to the Dongjiang outlet. These values were averaged over two years and multiplied by a factor of 2 (first number in the Table) and 3 (second number in the Table) in order to get DIN fluxes. These factors were derived based on an assumption that NH4-N contributes by about 30% to the total DIN (sum of NH4-N, NO2-N, NO3-N) inputs to the Dongjiang outlet according to Wu and Chen (2013). h – Concentrations of NH4-N and NO3-N (sum of them as DIN in Table) for the period of 1997-1999. These concentrations are from the lower reach of the Dongjiang River (Zengcheng and Dongguan cities). i –Annual averaged values of 1995-1999 for NO2-N, NO3-N, NH4-N (as DIN here) and mineral P (as DIP here) at the Boluo monitoring station, located near the outlet of the Dongjiang sub-basin. j - Values of NH4-N at the Wuzhou monitoring station for the Xijiang outlet and at the Nanning monitoring station for the Yujiang outlet are given on a weekly basis. The data were averaged for 2004 (available at the Ministry website (in Chinese) http://datacenter.mep.gov.cn/report/water/water.jsp?year=2004&wissue=20&x=22&y=5). Characteristics of the sub-basins (extended) Table A.5 Hydrological characteristics of the Pearl River sub-basins: actual (Qactj) and natural (Qnatj) water discharges, annual runoff from land to streams (Rnatj), nutrient retentions in reservoirs (DDIN.j, DDIP.j) of each sub-basin and nutrient losses (FQrem.j) from the river system of each sub-basin. Box A.1 and Table 1 provide descriptions of formulas and model inputs. Sub-basin (j) Year Qnatj (km3 year-1) Qactj (km3 year-1) Rnatj (m year-1) DDIN.j (0-1) DDIP.j (0-1) FQrem.j (0-1) Liujiang 1970 2000 2050 23.75 23.50 29.42 20.14 20.61 26.25 0.405 0.401 0.502 0.01 0.11 0.19 0.02 0.49 0.84 0.15 0.12 0.11 Yujiang 1970 2000 2050 26.39 19.90 22.25 23.44 16.28 18.39 0.344 0.260 0.290 0.01 0.03 0.04 0.05 0.09 0.15 0.11 0.18 0.17 Xijiang 1970 2000 2050 77.53 79.29 95.97 69.99 67.50 83.36 0.400 0.409 0.496 0.06 0.24 0.40 0.47 0.85 0.85 0.10 0.15 0.13 Beijiang 1970 2000 2050 18.20 17.73 22.68 16.60 15.64 20.32 0.590 0.574 0.735 0.00 0.25 0.42 0.01 0.85 0.85 0.09 0.12 0.10 Zhujiang delta 1970 2000 2050 31.87 30.01 34.19 25.66 21.98 25.64 0.661 0.622 0.709 0.01 0.03 0.05 0.02 0.20 0.33 0.19 0.27 0.25 Dongjiang 1970 2000 2050 24.95 22.06 24.70 22.18 18.49 19.64 0.736 0.651 0.729 0.07 0.15 0.44 0.21 0.48 0.85 0.11 0.16 0.20 Table A.6 Main characteristics of reservoirs associated with dams in the sub-basins of the Pearl River. Average values for dams/reservoir characteristics in each sub-basin are given outside of the parentheses. Minimum and maximum values are given inside of the parentheses. Source: GRanD database (Lehner et al. 2011a; Lehner et al. 2011b) Reservoir characteristics Volume (km3) Depth (m) Water discharge (km3 year-1) 1 4 0.56 0.27 (0.11-0.56)c 24 16 (12-24) 0.43 6.86 (0.43-12.99) Before 1970 Before 2000 3 5 0.62 (0.09-1.13) 0.46 (0.09-1.13) 40 (35-45) 33 (14-45) 0.44 (0.34-0.64) 0.34 (0.16-0.64) Xijiang Before 1970 Before 2000 12 28 0.40 (0.02-3.00) 0.72 (0.01-10.26) 23 (12-45) 33 (7-138) 3.55 (0.02-39.33) 7.75 (0.02-58.88) Beijiang Before 1970 Before 2000 1 7 0.18 (-) 0.53 (0.02-1.90) 16.1 (-) 33 (14-101) 0.14 (-) 5.45 (0.05-32.48) Zhujiang delta Before 1970 Before 2000 4 8 0.18 (0.04-0.35) 0.17 (0.04-0.35) 28 (19-37) 34 (13-100) 0.17 (0.04-0.46) 0.75 (0.01-5.03) Dongjiang Before 1970 Before 2000 4 12 3.51 (0.03-13.90) 1.38 (0.01-13.90) 29 (9-53) 22 (7-53) 1.35 (0.03-5.23) 0.87 (0.03-5.23) Sub-basin name Year Liujiang Before 1970a Before 2000b Yujiang Number of reservoirs/dams 5 68 69 70 71 72 a Reservoirs associated with dams that were constructed between 1957 and 1969. b Reservoirs associated with dams that were constructed between 1957 and 2000. c Average values (outside of the parentheses) of reservoir volumes for each sub-basin are calculated as the sum of volume of all reservoirs in the sub-basin divided by the number of reservoirs in this sub-basin. The same implies for depth and water discharge. 73 74 75 76 77 78 79 80 81 82 83 84 85 86 Figure A.1. Global gridded data compared to Chinese county data that were aggregated to the sub-basins of the Pearl River for model inputs in 2000: N and P fertilizer use (Tg), N and P manure excretion (Tg), biological N fixation by agricultural crops (Tg), total population (billion people) and the drainage areas of the sub-basins (thousand km2). These model inputs are shown in different dots on the graph (black dots for N and white dots for P) for six sub-basins of the Pearl River namely the Liujiang, Yujiang (up-stream), Xijiang, Beijiang (middle-stream), Dongjiang and Zhujiang delta (down-stream) (see Figure 1 in the manuscript). Global gridded datasets were prepared by Bouwman et al. (2009) for agricultural-related model inputs and by Van Drecht et al. (2009) for sewage-related model inputs. Chinese county dataset was provided by Data Center for Resources and Environmental Sciences of Chinese Academy of Sciences (RESDC). Using this county dataset (e.g., number of animals per county, human population per county) and information from Ma et al. (2012) (e.g., excretion rates for N and P in animal manure), the model inputs shown on the graph were prepared per county and then aggregated to the sub-basins of the Pearl River for 2000 by Wang M. (pers. comm.). RP2 is the Pearson’s coefficient of determination (the square of the correlation coefficient). 87 References 88 89 Bouwman AF, Beusen AHW, Billen G (2009) Human alteration of the global nitrogen and phosphorus soil balances for the period 1970–2050. Global Biogeochemical Cycles 23: GB0A04 90 91 Fekete BM, Wisser D, Kroeze C, Mayorga E, Bouwman L, Wollheim WM, Vörösmarty C (2010) Millennium ecosystem assessment scenario drivers (1970–2050): climate and hydrological alterations. Global Biogeochemical Cycles 24: GB0A12 92 93 Ho K, Hui K (2001) Chemical contamination of the East River (Dongjiang) and its implication on sustainable development in the Pearl River Delta. Environment International 26(5): 303-308 94 95 Lehner B, Liermann CR, Revenga C, Vörösmarty C, Fekete B, Crouzet P, Döll P, Endejan M, Frenken K, Magome J (2011a) Global Reservoir and Dam (GRanD) database. p.12 96 97 98 Lehner B, Liermann CR, Revenga C, Vörösmarty C, Fekete B, Crouzet P, Döll P, Endejan M, Frenken K, Magome J (2011b) High-resolution mapping of the world's reservoirs and dams for sustainable river-flow management. Front Ecol Environ 9(9): 494-502 99 100 Liu S, Hong G, Zhang J, Ye X, Jiang X (2009) Nutrient budgets for large Chinese estuaries. Biogeosciences 6(10): 22452263 101 102 Lu F-H, Ni H-G, Liu F, Zeng EY (2009) Occurrence of nutrients in riverine runoff of the Pearl River Delta, South China. J Hydrol 376(1): 107-115 103 104 105 Ma L, Velthof GL, Wang FH, Qin W, Zhang WF, Liu Z, Zhang Y, Wei J, Lesschen JP, Ma WQ, Oenema O, Zhang FS (2012) Nitrogen and phosphorus use efficiencies and losses in the food chain in China at regional scales in 1980 and 2005. The Science of the total environment 434: 51-61 6 106 107 108 Mayorga E, Seitzinger SP, Harrison JA, Dumont E, Beusen AHW, Bouwman AF, Fekete BM, Kroeze C, Van Drecht G (2010) Global Nutrient Export from WaterSheds 2 (NEWS 2): Model development and implementation. Environmental Modelling & Software 25(7): 837-853 109 Meybeck M (1982) Carbon, nitrogen, and phosphorus transport by world rivers. Am. J. Sci 282(4): 401-450 110 111 Meybeck M, Ragu A (1995) River discharges to the oceans: An assessment of suspended solids, major ions and nutrients. UNEP: 112 113 RESDC Data Center for Resources and Environmental Sciences Chinese Academy of Sciences Available at http://english.igsnrr.cas.cn/sd/ Accessed 01-02 2014: 114 115 Strokal M, de Vries W (2012) Dynamic modelling of phosphorus export at river basin scale based on Global NEWS. In: Alterra Report 2321. Alterra, part of Wageningen UR, Wageningen. p 100 116 117 Van Drecht G, Bouwman AF, Harrison J, Knoop JM (2009) Global nitrogen and phosphate in urban wastewater for the period 1970 to 2050. Global Biogeochemical Cycles 23: GB0A03 118 119 Vörösmarty C, Fekete B, Meybeck M, Lammers R (2000) Global system of rivers: Its role in organizing continental land mass and defining land‐to‐ocean linkages. Global Biogeochemical Cycles 14(2): 599-621 120 121 Wu Y, Chen J (2013) Investigating the effects of point source and nonpoint source pollution on the water quality of the East River (Dongjiang) in South China. Ecological Indicators 32: 294-304 122 Zhang J (1996) Nutrient elements in large Chinese estuaries. Continental Shelf Research 16(8): 1023-1045 123 124 Zhang J (2002) Biogeochemistry of Chinese estuarine and coastal waters: nutrients, trace metals and biomarkers. Regional Environmental Change 3(1-3): 65-76 125 126 Zhang J, Huang W, Liu M, Cui J (1994) Eco-social impact and chemical regimes of large Chinese rivers—a short discussion. Water Res. 28(3): 609-617 127 128 Zhang J, Yu Z, Wang J, Ren J, Chen H, Xiong H, Dong L, Xu W (1999) The subtropical Zhujiang (Pearl River) estuary: nutrient, trace species and their relationship to photosynthesis. Estuar. Coast. Shelf Sci. 49(3): 385-400 129 130 Zhou T, Wu J, Peng S (2012) Assessing the effects of landscape pattern on river water quality at multiple scales: A case study of the Dongjiang River watershed, China. Ecological Indicators 23: 166-175 131 7
