Weather Journal Instructions
advertisement
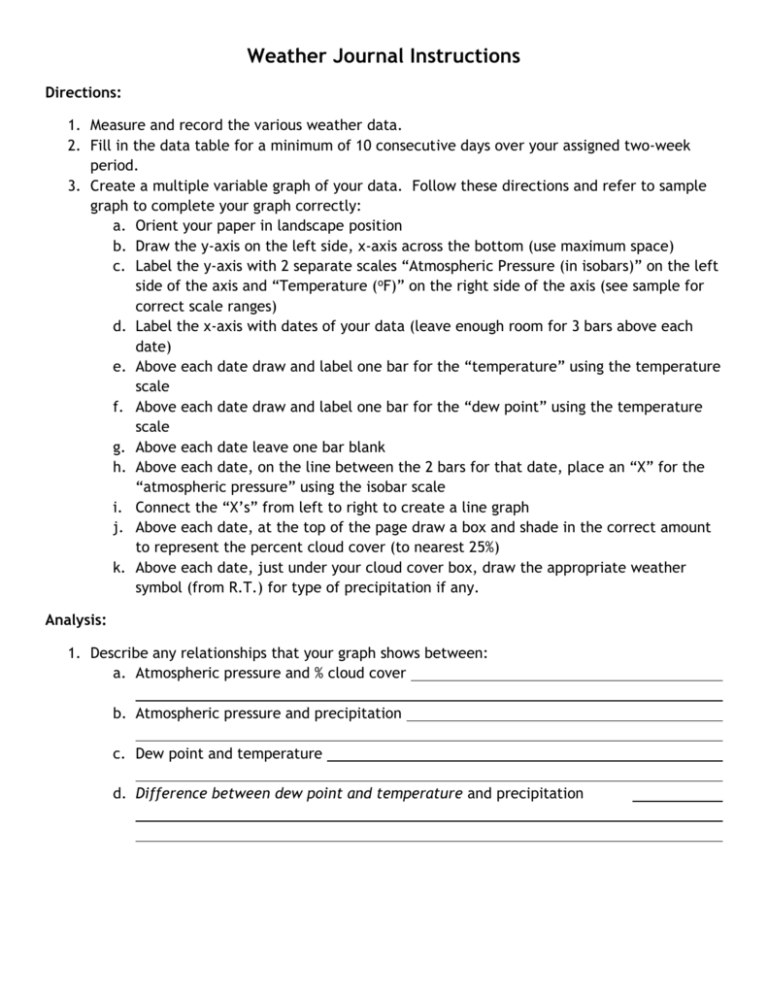
Weather Journal Instructions Directions: 1. Measure and record the various weather data. 2. Fill in the data table for a minimum of 10 consecutive days over your assigned two-week period. 3. Create a multiple variable graph of your data. Follow these directions and refer to sample graph to complete your graph correctly: a. Orient your paper in landscape position b. Draw the y-axis on the left side, x-axis across the bottom (use maximum space) c. Label the y-axis with 2 separate scales “Atmospheric Pressure (in isobars)” on the left side of the axis and “Temperature (oF)” on the right side of the axis (see sample for correct scale ranges) d. Label the x-axis with dates of your data (leave enough room for 3 bars above each date) e. Above each date draw and label one bar for the “temperature” using the temperature scale f. Above each date draw and label one bar for the “dew point” using the temperature scale g. Above each date leave one bar blank h. Above each date, on the line between the 2 bars for that date, place an “X” for the “atmospheric pressure” using the isobar scale i. Connect the “X’s” from left to right to create a line graph j. Above each date, at the top of the page draw a box and shade in the correct amount to represent the percent cloud cover (to nearest 25%) k. Above each date, just under your cloud cover box, draw the appropriate weather symbol (from R.T.) for type of precipitation if any. Analysis: 1. Describe any relationships that your graph shows between: a. Atmospheric pressure and % cloud cover b. Atmospheric pressure and precipitation c. Dew point and temperature d. Difference between dew point and temperature and precipitation
