file - BioMed Central
advertisement
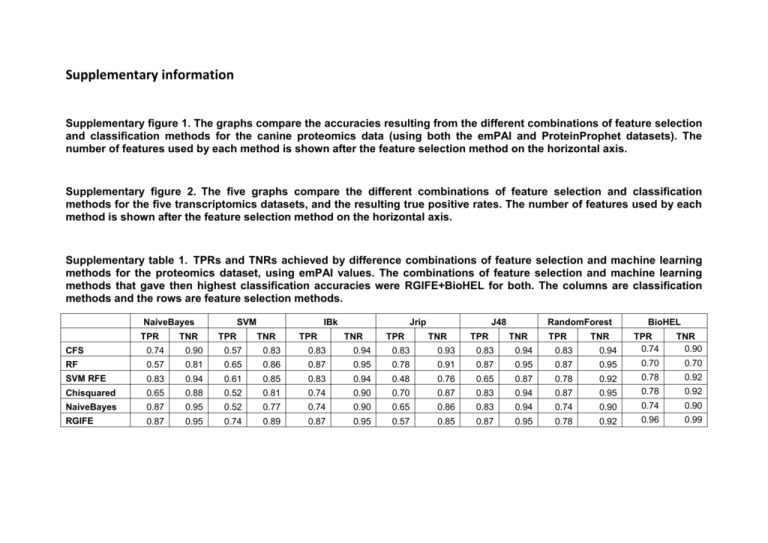
Supplementary information Supplementary figure 1. The graphs compare the accuracies resulting from the different combinations of feature selection and classification methods for the canine proteomics data (using both the emPAI and ProteinProphet datasets). The number of features used by each method is shown after the feature selection method on the horizontal axis. Supplementary figure 2. The five graphs compare the different combinations of feature selection and classification methods for the five transcriptomics datasets, and the resulting true positive rates. The number of features used by each method is shown after the feature selection method on the horizontal axis. Supplementary table 1. TPRs and TNRs achieved by difference combinations of feature selection and machine learning methods for the proteomics dataset, using emPAI values. The combinations of feature selection and machine learning methods that gave then highest classification accuracies were RGIFE+BioHEL for both. The columns are classification methods and the rows are feature selection methods. NaiveBayes TPR 0.90 0.57 0.83 0.83 0.94 0.83 0.93 0.83 0.94 0.83 0.94 0.81 0.65 0.86 0.87 0.95 0.78 0.91 0.87 0.95 0.87 0.95 0.70 0.70 SVM RFE 0.83 0.94 0.61 0.85 0.83 0.94 0.48 0.76 0.65 0.87 0.78 0.92 0.78 0.92 Chisquared 0.65 0.88 0.52 0.81 0.74 0.90 0.70 0.87 0.83 0.94 0.87 0.95 0.78 0.92 NaiveBayes 0.87 0.95 0.52 0.77 0.74 0.90 0.65 0.86 0.83 0.94 0.74 0.90 0.74 0.90 0.92 0.96 0.99 0.87 0.95 TPR 0.57 TNR 0.85 TPR 0.87 TNR 0.95 TPR 0.78 TNR BioHEL 0.57 0.89 TNR RandomForest 0.74 0.74 TPR J48 RF 0.95 TNR Jrip CFS 0.87 TPR IBk TPR 0.74 RGIFE TNR SVM TNR 0.90 Supplementary table 2. TPRs and TNRs achieved by difference combinations of feature selection and machine learning methods for the proteomics dataset, using ProteinProphet probabilities. The combinations of feature selection and machine learning methods that gave then highest classification accuracies were RGIFE combined with IBk and Naïve Bayes feature selection combined with Naïve Bayes classification method. The columns are classification methods and the rows are feature selection methods. NaiveBayes TPR TNR SVM TPR IBk TNR TPR Jrip TNR TPR J48 TNR TPR RandomForest TNR TPR TNR BioHEL CFS 0.78 0.92 0.91 0.97 0.78 0.92 0.74 0.89 0.70 0.88 0.74 0.90 TPR 0.61 TNR 0.82 RF 0.91 0.97 0.83 0.94 0.87 0.96 0.52 0.76 0.70 0.88 0.83 0.94 0.57 0.82 SVM RFE 0.74 0.9 0.83 0.94 0.87 0.95 0.65 0.85 0.65 0.86 0.83 0.93 Chisquared 0.83 0.94 0.91 0.97 0.78 0.92 0.65 0.85 0.70 0.88 0.65 0.85 0.65 0.57 0.86 0.82 NaiveBayes 0.96 0.98 0.87 0.95 0.87 0.95 0.70 0.88 0.70 0.88 0.78 0.92 0.61 0.82 RGIFE 0.78 0.91 0.83 0.94 0.96 0.99 0.70 0.82 0.65 0.86 0.70 0.88 0.91 0.97 Supplementary table 3. TPRs and TNRs achieved by difference combinations of feature selection and machine learning methods for GSE3698. RGIFE+BioHEL gave the highest classification accuracy, along with SVM RFE combined with SVM and IBk. The columns are classification methods and the rows are feature selection methods. NaiveBayes SVM TPR TPR TNR IBk TNR TPR Jrip TNR J48 TPR TNR TPR TNR RandomForest BioHEL TPR TNR 0.82 0.9 TNR CFS 0.77 0.86 0.88 0.93 0.69 0.81 0.58 0.70 0.73 0.84 0.77 0.85 TPR 0.73 RF 0.56 0.72 0.50 0.66 0.69 0.80 0.73 0.82 0.77 0.87 0.79 0.87 0.83 SVM RFE 0.96 0.97 1.00 1.00 1.00 1.00 0.63 0.76 0.69 0.81 0.85 0.91 0.83 0.9 0.88 Chisquared 0.81 0.85 0.77 0.85 0.83 0.89 0.63 0.75 0.71 0.81 0.79 0.87 0.81 NaiveBayes 0.94 0.96 0.83 0.90 0.77 0.88 0.67 0.79 0.88 0.93 0.81 0.88 0.79 0.86 RGIFE 0.90 0.93 0.94 0.96 0.92 0.95 0.79 0.86 0.75 0.84 0.85 0.91 1.00 1.00 Supplementary table 4. TPRs and TNRs achieved by difference combinations of feature selection and machine learning methods for GSE36700. SVM RFE gave the highest classification accuracy, when combined with Naïve Bayes, SVM and IBk. The columns are classification methods and the rows are feature selection methods. NaiveBayes SVM TPR TPR TNR IBk TNR Jrip TPR TNR TPR J48 TNR TPR TNR RandomForest BioHEL TPR TNR 0.86 TNR CFS 0.60 0.84 0.68 0.89 0.60 0.86 0.36 0.67 0.40 0.74 0.76 0.94 TPR 0.64 RF 0.72 0.89 0.68 0.87 0.56 0.82 0.40 0.72 0.92 0.96 0.92 0.96 0.68 0.87 SVM RFE 1.00 1.00 1.00 1.00 1.00 1.00 0.76 0.91 0.68 0.90 0.88 0.96 0.72 0.89 Chisquared 0.76 0.92 0.88 0.97 0.84 0.96 0.68 0.86 0.80 0.95 0.88 0.96 0.68 0.87 NaiveBayes 0.88 0.96 0.60 0.82 0.76 0.91 0.68 0.88 0.80 0.94 0.88 0.97 0.72 0.89 RGIFE 0.84 0.98 0.84 0.95 0.96 0.98 0.52 0.78 0.52 0.81 0.76 0.91 0.96 0.98 Supplementary table 5. TPRs and TNRs achieved by difference combinations of feature selection and machine learning methods for E-GEOD-12021. SVM RFE gave the highest classification accuracy, when combined with Naïve Bayes, SVM and IBk. The columns are classification methods and the rows are feature selection methods. NaiveBayes SVM TPR TPR TNR IBk TNR TPR Jrip TNR TPR J48 TNR TPR TNR RandomForest BioHEL TPR TNR 0.74 TNR CFS 0.90 0.95 0.94 0.97 0.74 0.85 0.68 0.79 0.87 0.93 0.94 0.96 TPR 0.74 RF 0.81 0.89 0.90 0.96 0.87 0.93 0.68 0.81 0.87 0.93 0.87 0.93 0.94 0.94 SVM RFE 1.00 1.00 1.00 1.00 1.00 1.00 0.65 0.78 0.61 0.77 0.84 0.92 0.77 0.88 Chisquared 0.84 0.90 0.84 0.92 0.87 0.94 0.65 0.77 0.67 0.79 0.81 0.88 0.77 0.88 NaiveBayes 0.97 0.98 0.87 0.92 0.90 0.94 0.81 0.88 0.74 0.85 0.74 0.84 0.81 0.91 RGIFE 0.84 0.91 0.90 0.95 0.84 0.91 0.77 0.87 0.71 0.83 0.77 0.88 0.97 0.98 Supplementary table 6. TPRs and TNRs achieved by difference combinations of feature selection and machine learning methods for E-GEOD-27390. RGIFE combined with either Random Forest or BioHEL have an accuracy of 100%. Chisquared, when combined with Naïve Bayes, SVM and IBk, and RF combined with Naïve Bayes, IBk or RF also gave an accuracy of 100%. The columns are classification methods and the rows are feature selection methods. NaiveBayes SVM TPR TPR TNR IBk TNR Jrip TPR TNR TPR J48 TNR TPR TNR RandomForest BioHEL TPR TNR 0.90 TNR CFS 1.00 1.00 1.00 1.00 1.00 1.00 0.90 0.89 0.95 0.94 0.90 0.91 TPR 0.90 RF 1.00 1.00 0.90 0.88 1.00 1.00 0.95 0.94 0.95 0.94 1.00 1.00 0.95 0.95 SVM RFE 0.84 0.82 0.95 0.94 0.84 0.85 0.63 0.61 0.79 0.79 0.79 0.79 0.42 0.38 Chisquared 1.00 1.00 1.00 1.00 1.00 1.00 0.90 0.89 0.95 0.95 0.90 0.88 0.95 0.95 NaiveBayes 0.95 0.94 0.95 0.95 0.95 0.95 0.90 0.89 0.95 0.94 0.95 0.95 0.95 0.95 RGIFE 0.79 0.77 0.95 0.94 0.90 0.89 0.84 0.84 0.95 0.94 1.00 1.00 1.00 1.00 Supplementary table 7. TPRs and TNRs achieved by difference combinations of feature selection and machine learning methods for E-GEOD-29746. The best combination was Random Forest for both FS and classification. The columns are classification methods and the rows are feature selection methods. NaiveBayes SVM TPR TPR TNR IBk TNR TPR Jrip TNR J48 TPR TNR TPR TNR RandomForest BioHEL TPR TNR 0.78 TNR CFS 0.68 0.83 0.81 0.89 0.71 0.82 0.42 0.59 0.74 0.86 0.77 0.87 TPR 0.61 RF 0.77 0.87 0.52 0.65 0.77 0.88 0.74 0.86 0.87 0.93 1.00 1.00 0.90 0.94 0.87 SVM RFE 0.94 0.97 1.00 1.00 0.97 0.98 0.61 0.76 0.84 0.92 0.81 0.91 0.77 Chisquared 0.68 0.80 0.71 0.83 0.87 0.93 0.68 0.82 0.81 0.90 0.94 0.97 0.87 0.93 NaiveBayes 0.94 0.96 0.77 0.87 0.84 0.90 0.87 0.93 0.94 0.97 0.94 0.96 0.90 0.94 RGIFE 0.61 0.78 0.87 0.93 0.84 0.91 0.48 0.65 0.71 0.86 0.71 0.84 0.84 0.90 Supplementary table 8. The genes in present in the GSE36700 dataset reduction with RGIFE after conversion of gene identifiers using DAVID. Gene ID IGKV3D-15 LAMP5 Gene Description and any known relevance to OA Immunoglobulin kappa variable 3D15 (gene/pseudogene) Lysosome-associated membrane glycoprotein 5 Unknown. IFI6 Interferon, alpha-inducible protein 6 Fn3k Fructosamine 3 kinase LOC10012 6583 Hypothetical LOC100126583 CYP2U1 Cytochrome P450, family 2, subfamily U, polypeptide 1 DYDC1 DPY30 domain containing 1 IGLC1 Immunoglobulin lambda FHL1 Four and a half LIM domains 1 TP53BP2 Tumour protein p53 binding protein, 2 THSD7A Thrombospondin, type I, domain containing 7A DMRT3 FAM30A Doublesex and mab-3 related transcription factor 3 Putative uncharacterized protein KIAA0125 RSAD2 Radical S-adenosyl methionine domain containing 2 PLA2G2D Phospholipase A2, group IID CXCL9 Chemokine (C-X-C motif) ligand 9 IGHD Ig delta chain C region VSIG7 HOXB9 DHX34 TRPM2 IGKJ5 1557896_a t V-set and immunoglobulin domain containing 7 Homeobox B9 DEAH (Asp-Glu-Ala-His) box polypeptide 34 transient receptor potential cation channel, subfamily M, member 2 Immunoglobulin kappa joining 5 Unknown. A member of the LAMP family. IFI6 has been reported to be involved in cell survival through the inhibition of apoptosis [61]. Fn3k is involved in cell metabolism and is related to deglycation of fructoselysine and of glycated proteins [62]. Hypothetical protein CYP2U1 is required for fatty acid signaling processes in both cerebellum and thymus [63]. DYDC1 is a protein found in the testis, which belongs to the dpy-30 family [64]. Contains an immunoglobulin-like domain [65]. FHL1 is involved in muscle development. Found to be down-regulated after IL-1β treatment [66]. tp53bp2 is involved in the regulation of apoptosis and cell growth [67]. THSD7A is known to promote endothelial cell migration and has been linked to osteoporosis [68]. Involved in embryonic development. Unknown. RSAD2 is an IFN-inducible anti-viral protein, which is induced by human cytomegalovirus [69]. RSAD2 has been found to be up-regulated in RA [39]. PLA2G2D is an enzyme which catalyses the calcium-dependent hydrolysis of the 2-acyl groups in 3-sn-phosphoglycerides. It has been linked to cytokine mediated inflammation [70]. A cytokine which affects the growth, activation state and movement of cells involved in inflammation and the immune system [71]. CLCX9 has been reported at higher levels in synovial tissue from RA patients [40]. IgD is an antigen receptor on the surface of Bcells [72]. Unknown. Involved in embryonic development [73]. An ATP-binding RNA helicase involved in embryonic development [74]. TRPM2 is a voltage-independent cation channel mediating sodium and calcium ion influx in response to oxidative stress [75]. Unknown. Unknown. Supplementary table 9. The genes present in the RGIFE-reduced GSE3698 dataset after conversion of gene identifiers using DAVID. Gene ID Gene Description and any known relevance to OA WBSCR5 Williams-Beuren syndrome chromosome region 5/ Linker for activation of T-cells family member 2 Similar to DNA segment, Chr 11/ Ribonuclease kappa Fibronectin 1 WBSCR5 is involved in FCER1-mediated signalling in mast cells [76]. MGC71993 FN1 FAM46A SGPL1 Family with sequence similarity 46, member A Limbic system-associated membrane protein, Apolipoprotein L, 3 Sphingosine-1-phosphate lyase 1 STK24 Serine/threonine kinase 24 COL22A1 Collagen, type XXII, alpha 1 CNGA1 Cyclic nucleotide gated channel alpha 1 CD3D antigen LSAMP CD3D PARP9 CLECSF6 Poly (ADP-ribose) polymerase family, member 9 C-type lectin domain family 4, member A DDR2 Discoidin domain receptor family, member 2 MMP-9 Matrix metalloproteinase 9 NOTCH3 Notch homolog 3 HEYL Hairy/enhancer-of-split related with YRPW motif-like S100A7 S100 calcium binding protein A7 (psoriasin 1) CADPS2 Ca2+-dependent activator protein for secretion 2 Hs.126945 Transcribed locus MGC71993 is an endoribonuclease which cleaves phosphodiester bonds [77]. Fibronectins are involved in various processes including cell motility, adhesion and maintenance of cell shape. Fibronectin is also involved in osteoblast compaction and mineralization [41]. A member of the FAM46 family, which has been identified in ocular tissues [78]. LSAMP is involved in the mediation of neuronal growth and axon targeting [79]. SGPL1 is known to cleave phosphorylated sphingoid bases into fatty aldehydes and phosphoethanolamine and elevates apoptosis [80]. STK24 is a serine/threonine-protein kinase that promotes apoptosis in response to caspase activation and stress [81]. COL22A1 functions as a cell adhesion ligand for skin epithelial cells and fibroblasts [82]. The opening of the cation channel and thereby causing a depolarization of rod photoreceptors [83]. CD3D is involved in T-cell maturation, through mediation of signal transduction [84]. PARP9 is involved in PARP1-dependent DNA damage repair [85]. CLECSF6 is thought to have a role in the regulation of immune reactivity and modulating dendritic cells (DC) differentiation and maturation [86]. DDR2 is a cell surface receptor known to bind type II collagen and up-regulate MMP-13. MMP-13 digests type II collagen, which is key to OA [42]. The gelatinase MMP-9 is an enzyme involved in inflammatory diseases. Higher levels of MMP-9 have been identified in synovial fluids from RA and OA patients [43]. NOTCH3 is involved in regulation of cell fate determination by acting as a receptor for specific membrane bound ligands. NOTCH3 affects differentiation, proliferation and apoptosis of cells and has been linked to RA [44, 87]. HEYL acts as a downstream effector of Notch signalling which is thought to be involved in cardiac development [88]. S100A7 is involved in calcium responsive signalling and has been found to be over expressed in inflammatory diseases [89]. Involved in large dense-core vesicle (LDCV)regulated exocytosis; it acts as a calcium sensor in constitutive vesicle trafficking and secretion [90]. Unknown. (Unigene ID) Supplementary table 10. The genes present in the RGIFE-reduced E-GEOD12021 dataset after conversion of gene identifiers using DAVID. Gene ID Gene Description and any known relevance to OA CXCL13 Chemokine (C-X-C motif) ligand 13 Chemotactic for B-lymphocytes but not for T-lymphocytes, monocytes and neutrophils. Suggested as a marker for RA. Elevated baseline CXCL13 levels were associated with increased rates of joint destruction [45]. UBD Ubiquitin D Ubiquitin-like protein modifier that can be covalently attached to target protein and subsequently leads to their degradation by the 26S proteasome. Increased expression of UBD found after treatment of human synovial fibroblasts isolated from patients with inflammatory arthritis with TNF-α [91]. TPD52 Tumor protein D52-like 1 The protein is reported to be involved in cell proliferation and calcium signalling. LRC42 Leucine rich containing 42 Belongs to the LRRC42 family. RM18 Mitochondrial ribosomal protein L18 repeat Together with thiosulfate sulfurtransferase (TST), acts as a mitochondrial import factor for the cytosolic 5S rRNA. Supplementary table 11. The genes present in the reduction by RGIFE of dataset E-GEOD-27390 after conversion of gene identifiers using DAVID. Gene ID PKNOX2 CABP1 RDH10 Gene Description and any known relevance to OA PBX/knotted 1 homeobox 2 PKNOX2 is a transcription factor involved in cell proliferation, differentiation and death [92]. CABP1 inhibits agonist-induced intracellular calcium signalling [93]. RDH10 is a retinol dehydrogenase that converts all-trans-retinol to all-trans-retinal. It is required for limb, craniofacial, and organ development [94]. Hypothetical protein Calcium binding protein 1 Retinol dehydrogenase 10 (alltrans) FBXO36 Hypothetical protein LOC283177 F-box protein 36 LOC344595 Hypothetical LOC344595 Hypothetical protein ATAD2 ATPase family, AAA domain containing 2 ATAD2 has been found to be Involved in the estrogen-induced cell proliferation and cell cycle progression of breast cancer cells [95]. PRPF18 is involved in pre-mRNA splicing [96]. LOC283177 PRPF18 HBS1L PRP18 pre-mRNA processing factor 18 homolog HBS1-like Unknown. hbs1l is a member of the GTP-binding elongation factor family [97]. Hypothetical protein LOC100131262 Hypothetical LOC100131262 SLC6A2 Solute carrier family 6 (neurotransmitter transporter, noradrenalin), member 2 SLC6A2 is an amine transporter, which stops the action of noradrenaline [98]. HMGB3P19 High mobility group box 3 pseudogene 19 Unknown. 236174_at Unknown. Unknown. 227509_x_at Unknown. Unknown. Supplementary table 12. Proteins selected by feature selection methods when applied to the canine proteomics dataset with ProteinProphet probabilities. The proteins in bold were selected by more than one method. CFS RF SVM RFE Chi squared Naïve Bayes RGIFE MMP3 APOE SECA2 MGP TPIS IL8 COMP MMP3 CD37 SHBG TPIS NRDZ PVRIG IL8 MLX CAPP TPIS APOE IL8 URE1 SECA2 HPLN1 FETUA PRO1 MMP3 MMP3 MGP IL8 SECA2 APOE TSP1 TPIS K2C1 LYSC1 MMP3 SECA2 TRY2 MGP TPIS IL8 MMP3 IL8 TSP1 HPLN1 APOE TPIS Supplementary table 13. Proteins selected by feature selection methods when applied to the canine proteomics dataset with emPAI values. The proteins in bold were selected by more than one method. CFS RF SVM RFE Chi squared Naïve Bayes RGIFE PGCA CLUS MMP3 IL8 PGCA CLUS K1C9 CATA MMP3 ENOB A1AT VIM1 YM22 IL8 PURL ALBU XYNA LEPA PRO1 CLUS MMP3 CLUS IL8 ENOA MGP VIME SAA PGCA TPIS LUM CLUS MMP3 FETUA POLG ATPX PGCA CLUS K2C1 TRY1 MGP A1AT ALBU YM22 Supplementary table 14. Genes selected by feature selection methods when applied to GSE3698. Where IDs could not be converted the array IDs are reported. The genes in bold were selected by more than one method. CFS RF SVM RFE Chisquared NaiveBayes RGIFE ITGBL1 HIF1AN MIG-6 TNIP2 DKFZP547N043 WBSCR5 CFLAR KIAA1458 LOC221442 SGPL1 IMAGp998A10184 MGC71993 ZNF324 VAMP8 ASS DDIT4 DKFZp434H2215 FN1 EMP3 SMC1L2 SEMA6D MARCKS C6orf80 FAM46A IMAGp998C02653 C6orf170 SLC25A5 ZCWCC1 LSAMP NGFR UPF3A NUPL2 SEMA6D SGPL1 MAGEB3 MMP9 CD3D AICDA STK24 IMAGp998C143515 OLFM3 VAMP8 COL22A1 FAM46A ATP6V1F CTSL CNGA1 PCBD NOTCH3 RALB CD3D PARP9 CLECSF6 DDR2 MMP9 NOTCH3 HEYL S100A7 CADPS2 Hs.126945 Supplementary table 15. Genes selected by feature selection methods when applied to GSE36700. Where IDs could not be converted the array IDs are reported. The gene in bold was selected by more than one method. CFS NFKBID 1553462_at CCDC34 OGDH CKAP2 TSC22D4 CD80 DYNLRB1 SLC11A1 FOXP2 RF SVM RFE Chisquared NaiveBayes RGIFE CORO6 CHSY3 CUL2 GBP1 IGKV3D-15 KIAA1826 NBL1 LAIR2 TRIOBP LAMP5 GCH1 RASGRP1 RAB8A RSAD2 IFI6 DUSP18 MGAT3 MEF2C Fn3k PGF SFRS14 LOC100126583 FN1 ITBP3 CYP2U1 CXorf57 RAP2A DYDC1 BTBD1 SCARA3 IGLC1 IFIT3 COL12A1 FHL1 SIPA1L3 FAM110B TP53BP2 THSD7A DMRT3 FAM30A RSAD2 PLA2G2D CXCL9 IGHD VSIG7 HOXB9 DHX34 TRPM2 IGKJ5 1557896_at Supplementary table 16. Genes selected by feature selection methods when applied to E-GEOD-12021. Where IDs could not be converted the array IDs are reported. The genes in bold were selected by more than one method. CFS PKNOX2 RPS13 RPL9 LRP1 MCL1 MAP4 DNAJA1 SNX17 CDH1 MBNL1 RF SVM RFE Chisquared NaiveBayes RGIFE DDX24 SPTBN1 CDH1 TMEM80 CXCL13 TNFAIP3 ACY1 PFKFB3 HEXA UBD STK38 USP46 E2F3 GABARAPL1 TPD52 RPL38 SKAP2 ADAMDEC1 LRC42 RNF125 GABARAPL1 RM18 ADAM7 215373_x_at CDC14B 217679_x_at CSNK2A1 RAP2C CYorf15B RNF34 MICALL1 HAUS2 Supplementary table 17. Genes selected by feature selection methods when applied to E-GEOD-27390. Where IDs could not be converted the array IDs are reported. The genes in bold were selected by more than one method. CFS HNRNPC RF ERH SVM RFE NBL1 SEPT2 RASGRP1 NARS MGAT3 ERH PGF CLTC FN1 CALM1 CXorf57 DDX24 BTBD1 DYNLL1 SIPA1L3 PTP4A1 IFIT3 BTG1 CHSY3 Chisquared NaiveBayes RGIFE EIF1 HNRNPC PKNOX2 EIF1 CABP1 SIGLEC7 RDH10 ORC6L LOC283177 NSD1 FBXO36 236898_at LOC344595 240616_at ATAD2 CALM1 PRPF18 CALM1 HBS1L 1558801_at LOC100131262 SLC6A2 HMGB3P19 236174_at 227509_x_at
