Introduction - British Renal Society
P147
DOES THE MEASUREMENT OF PULSE WAVE VELOCITY AND/OR PULSE WAVE
ANALYSIS PREDICT HOW WE SHOULD MANAGE HYPERTENSION IN
HAEMODIALYSIS PATIENTS ?
Crawford, S, Jones, C
Renal Services, York Hospitals NHS Foundation Trust
INTRODUCTION:
The majority of haemodialysis (HD) patients have hypertension which is associated with an increased risk of cardiovascular death. The introduction of a nurse led blood pressure (BP) management protocol in our unit led to an improvement in BP outcome, with a reduction in dry weight (DW) and antihypertensive medication (ATH’s) However, DW reduction can lead to severe symptoms in some patients. Currently available assessment techniques do not allow accurate prediction of which patients will not tolerate BP reduction. We previously reported preliminary findings looking at the measured PWV. We have now begun to analyze the wave form morphology, which may be a more useful way of predicting BP response to dry weight reduction.
OBJECTIVES:
The purpose of this study is to investigate whether pulse wave analysis in managing hypertension in HD patients.
METHODS:
Hypertension is confirmed by 24 hour ambulatory BP or home monitoring. Pulse wave form
(augmentation index) and pulse wave velocity (PWV) are measured by applanation tonometry and hydration status by bioelectric impedance. BP is managed through a nurse led protocol.
Patients are classified as “at outcome” once they have achieved target zone for DW on the
Fresenius Fluid Management Tool. Intradialytic symptoms are recorded.
RESULTS:
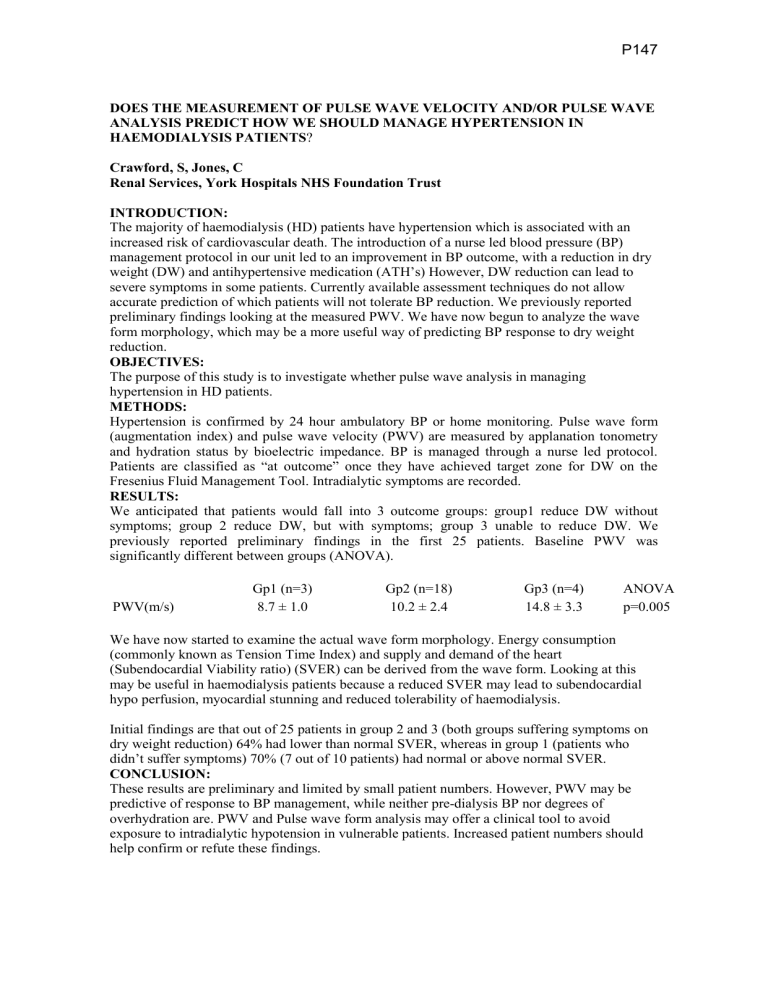
We anticipated that patients would fall into 3 outcome groups: group1 reduce DW without symptoms; group 2 reduce DW, but with symptoms; group 3 unable to reduce DW. We previously reported preliminary findings in the first 25 patients. Baseline PWV was significantly different between groups (ANOVA).
PWV(m/s)
Gp1 (n=3)
8.7 ± 1.0
Gp2 (n=18)
10.2 ± 2.4
Gp3 (n=4)
14.8 ± 3.3
ANOVA p=0.005
We have now started to examine the actual wave form morphology. Energy consumption
(commonly known as Tension Time Index) and supply and demand of the heart
(Subendocardial Viability ratio) (SVER) can be derived from the wave form. Looking at this may be useful in haemodialysis patients because a reduced SVER may lead to subendocardial hypo perfusion, myocardial stunning and reduced tolerability of haemodialysis.
Initial findings are that out of 25 patients in group 2 and 3 (both groups suffering symptoms on dry weight reduction) 64% had lower than normal SVER, whereas in group 1 (patients who didn’t suffer symptoms) 70% (7 out of 10 patients) had normal or above normal SVER.
CONCLUSION:
These results are preliminary and limited by small patient numbers. However, PWV may be predictive of response to BP management, while neither pre-dialysis BP nor degrees of overhydration are. PWV and Pulse wave form analysis may offer a clinical tool to avoid exposure to intradialytic hypotension in vulnerable patients. Increased patient numbers should help confirm or refute these findings.


