4.1 Probability Distributions
advertisement
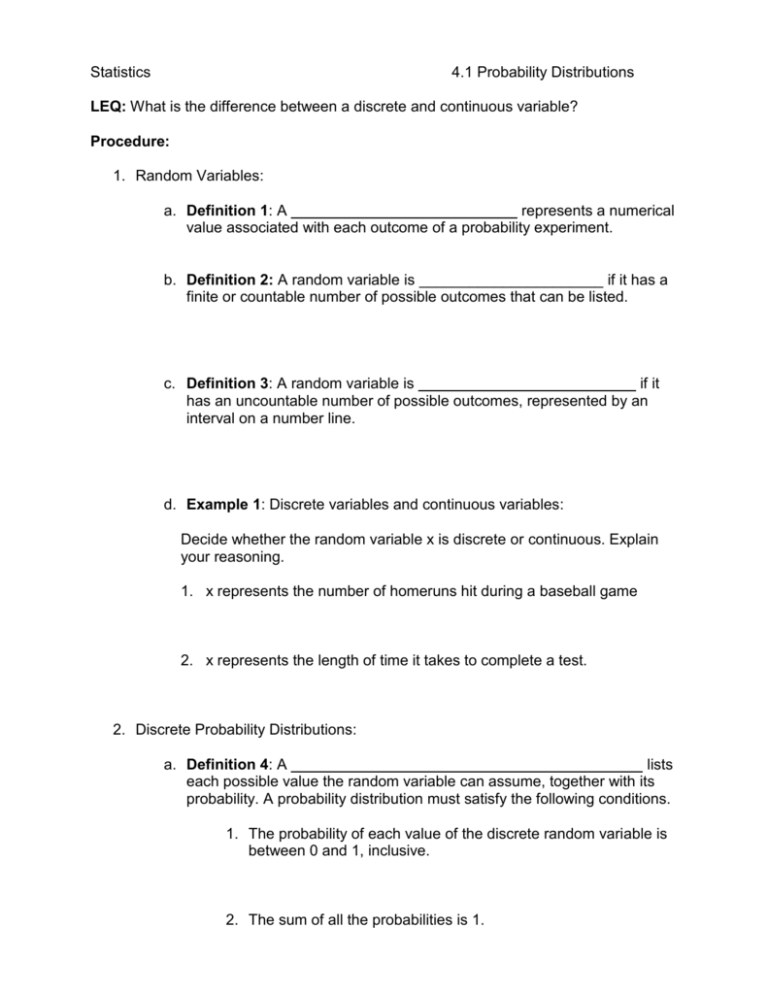
Statistics 4.1 Probability Distributions LEQ: What is the difference between a discrete and continuous variable? Procedure: 1. Random Variables: a. Definition 1: A ___________________________ represents a numerical value associated with each outcome of a probability experiment. b. Definition 2: A random variable is ______________________ if it has a finite or countable number of possible outcomes that can be listed. c. Definition 3: A random variable is __________________________ if it has an uncountable number of possible outcomes, represented by an interval on a number line. d. Example 1: Discrete variables and continuous variables: Decide whether the random variable x is discrete or continuous. Explain your reasoning. 1. x represents the number of homeruns hit during a baseball game 2. x represents the length of time it takes to complete a test. 2. Discrete Probability Distributions: a. Definition 4: A __________________________________________ lists each possible value the random variable can assume, together with its probability. A probability distribution must satisfy the following conditions. 1. The probability of each value of the discrete random variable is between 0 and 1, inclusive. 2. The sum of all the probabilities is 1. b. Guidelines: Constructing a Discrete Probability Distribution: Let x be a discrete random variable with possible outcomes x1 , x2 ,..., xn . i. Make a frequency distribution for the possible outcomes. ii. Find the sum of the frequencies. iii. Find the probability of each possible outcome by dividing its frequency by the sum of the frequencies. iv. Check that each probability is between 0 and 1 and that the sum is 1. c. Example 2: Constructing and graphing a discrete probability distribution: An industrial psychologist administered a personality inventory test for passive-aggressive traits to 150 employees. Individuals were rated on a score from 1 to 5, where 1 was extremely passive and 5 extremely aggressive. A score of 3 indicated neither trait. The results are shown below. Construct a probability distribution for the random variable x. Then graph the distribution using a histogram. Score, x 1 2 3 4 5 Frequency, f 24 33 42 30 21 d. Example 3: Verifying probability distributions: Verify that the distribution below is a probability distribution. Days of rain, x 0 1 2 3 Probability, P(x) 0.216 0.432 0.288 0.064 3. Mean, Variance, and Standard Deviation: a. Definition 5: The __________ of a discrete random variable is given by Each value of x is multiplied by its corresponding probability and that products are added. b. Example 4: Finding the mean of a probability distribution: The probability distribution for the personality inventory test for passiveaggressive traits discussed in example 2 is given below. Find the mean score. What can you conclude? x P(x) 1 0.16 2 0.22 3 0.28 4 0.20 5 0.14 xP(x) c. Definition 6: The __________________ of a discrete random variable is The _______________________________ is d. Example 5: Finding the variance and standard deviation: The probability distribution for the personality inventory test for passiveaggressive traits discussed in example 2 is given below. Find the variance and standard deviation of the probability distribution. x P(x) 1 0.16 2 0.22 3 0.28 4 0.20 5 0.14 4. Expected Value: a. Definition 7: The ________________________________ of a discrete random variable is equal to the mean of the random variable. b. Example 5: Finding an expected value: At a raffle, 1500 tickets are sold at $2 each for 4 prizes of $500, $250, $150, and $75. You buy one ticket. What is the expected value of your gain? c. Example 6: During a one-year selling period (225 days), a sales representative made between 0 and 9 sales per day, as shown in the table. If this pattern continues, what is the expected value for the number of sales per day? Number of sales, x Frequency, f (in days) 5. HW: 0 1 2 3 4 5 6 7 8 9 25 48 60 45 20 10 8 5 3 1

