Characterization and Validation Supplement Characterization of
advertisement
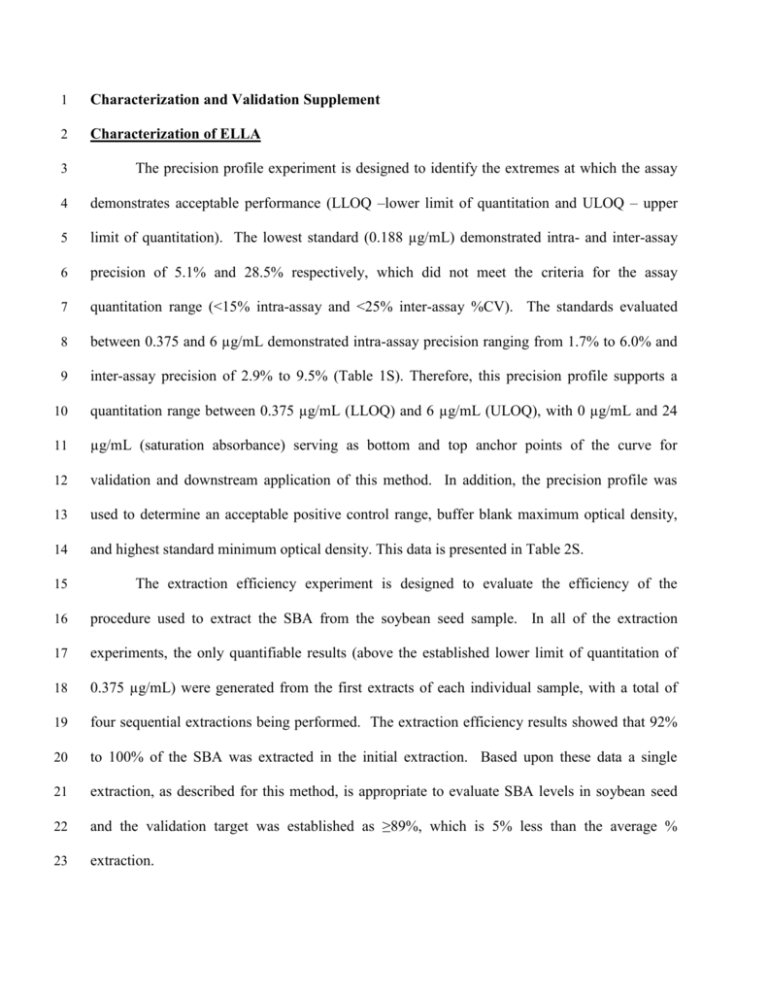
1 Characterization and Validation Supplement 2 Characterization of ELLA 3 The precision profile experiment is designed to identify the extremes at which the assay 4 demonstrates acceptable performance (LLOQ –lower limit of quantitation and ULOQ – upper 5 limit of quantitation). The lowest standard (0.188 µg/mL) demonstrated intra- and inter-assay 6 precision of 5.1% and 28.5% respectively, which did not meet the criteria for the assay 7 quantitation range (<15% intra-assay and <25% inter-assay %CV). The standards evaluated 8 between 0.375 and 6 µg/mL demonstrated intra-assay precision ranging from 1.7% to 6.0% and 9 inter-assay precision of 2.9% to 9.5% (Table 1S). Therefore, this precision profile supports a 10 quantitation range between 0.375 µg/mL (LLOQ) and 6 µg/mL (ULOQ), with 0 µg/mL and 24 11 µg/mL (saturation absorbance) serving as bottom and top anchor points of the curve for 12 validation and downstream application of this method. In addition, the precision profile was 13 used to determine an acceptable positive control range, buffer blank maximum optical density, 14 and highest standard minimum optical density. This data is presented in Table 2S. 15 The extraction efficiency experiment is designed to evaluate the efficiency of the 16 procedure used to extract the SBA from the soybean seed sample. In all of the extraction 17 experiments, the only quantifiable results (above the established lower limit of quantitation of 18 0.375 µg/mL) were generated from the first extracts of each individual sample, with a total of 19 four sequential extractions being performed. The extraction efficiency results showed that 92% 20 to 100% of the SBA was extracted in the initial extraction. Based upon these data a single 21 extraction, as described for this method, is appropriate to evaluate SBA levels in soybean seed 22 and the validation target was established as ≥89%, which is 5% less than the average % 23 extraction. 24 The spike and recovery experiments were conducted to determine the expected range of 25 recoveries possible with the ELLA method to describe the accuracy of the method across three 26 spike levels. Recovery at the three spike levels (0.5, 1.5 and 3 µg/mL) ranged from 69 to 95% of 27 the spiked concentration. 28 measurement was between 5.3 to 9.5%. Based upon the data generated during characterization, 29 the validation target was 64% to 100% recovery (± 5% of characterization data). Across all spike levels the average precision of the recovery 30 Dilutional parallelism experiments were conducted to evaluate the lowest dilution level 31 that could provide results within the quantitation range to be used in further matrix effects 32 experiments. In addition, the accuracy of the ELLA assay was demonstrated by determining the 33 percent relative difference of each dilution to the average sample concentration value. During 34 characterization four dilution levels were tested (1:10, 1:20, 1:40 and 1:80 sample extract to 35 buffer ratio). The highest dilution level tested (1:80) was out of the quantitation range. For the 36 purposes of this assay, as the lowest dilution level tested (1:10) was within the quantitation 37 range, no additional dilution levels were evaluated. The data was summarized by calculating an 38 average concentration across all dilutions, then the individual dilution values were compared to 39 the across dilution average and converted to a percentage. The range of observed values was 69 40 to 125%. Based upon the data generated during method characterization, the validation target 41 was 64% to 130% (± 5% of characterization data). 42 The matrix effects experiments determined to what extent the other components present 43 in soybean seed influence the ability of the ELLA analysis to accurately quantitate SBA in the 44 presence of the matrix. To evaluate the largest potential matrix effect all experiments were 45 conducted at the lowest tested dilution level (1:10 soybean extract to buffer ratio). Across all 46 three plates and four spike levels (0.5, 1, 2 and 4 µg/mL), an overall average of 104% recovery 47 was observed. Individual spike recovery values ranged from 79% to 132% recovery, with % CV 48 at each recovery level ranging from 6.6% to 15%. Based upon these data, the target range for 49 validation (± 5% of characterization data) was established at 74% to 137% recovery. 50 A summary of the data-based validation acceptance criteria obtained through the characterization 51 experiments is presented in the main manuscript text, Table 3. 52 53 Table 1S. Assay Precision Profile determines Intra- and Inter-Assay variability and establishes the Lower and Upper Limit of Quantitation (LLOQ and ULOQ). 54 55 56 57 58 At a concentration of 24µg/mL, the assay is near saturation and this is considered the anchor point. The precision of the anchor point was evaluated but did not need to conform to the evaluation criteria. With the exception of the lowest standard (0.188 µg/mL) all other standards used in the precision profile conformed to an intra-assay %CV lower than 15% and an inter-assay %CV lower than 25%. Based upon these data, the 0.188 µg/mL standard did not demonstrate measurement precision reflective of what would be expected of a quantifiable standard. Based upon these results, the LLOQ was defined to be 0.375 µg/mL. Std Conc. (μg/mL) 24 6 3 1.5 0.75 0.375 0.188 Average: Intra-Assay %CV 27.8 5.6 3.4 1.7 2.7 6.0 5.1 4.1 Intra Criteria %CV Based on Concentration n/a 15% 15% 15% 15% 15% 15% requirement <15% Inter-Assay %CV 30.3 6.1 4.8 2.9 5.7 9.5 28.5 9.6 Inter Criteria %CV Based on Concentration n/a 25% 25% 25% 25% 25% 25% requirement <25% 59 60 61 62 Table 2S. The precision profile was used to determine the acceptable value range for the positive control concentration, and the maximum buffer blank optical density and minimum highest standard optical density. The highest standard considered for this assessment was required to be within the limits of quantitation, for this reason the optical densities of the 6 μg/mL standard were evaluated. Positive control range 0.922-1.887 μg/mL Maximum buffer blank optical density 0.035 AU Minimum highest standard (6μg/mL) optical density 0.767 AU 63 AU- Absorbance Units 64 ELLA Validation Data 65 Table 3S. Validation Data for Extraction Efficiency Extraction 1 Extraction 2 Extraction 3 Extraction 4 % Extraction Efficiency 66 Sample #3 (μg/mg) 2.459 0.105 0.075 0.085 92 89 90 Buffer Spike Theoretical Value µg/ml 3.000 1.500 0.500 1 2 3 Buffer Spike - Actual Value µg/ml 2.810 1.431 0.419 Buffer Spike %Recovery 94 95 84 Sample (µg/ml) 2.122 1.110 0.384 % Recovery of Sample vs. Buffer Spike (actual value) 76 78 92 Table 5S. Validation Data for Matrix Effects Spike # 68 Sample #2 (μg/mg) 2.393 0.147 0.061 0.077 Table 4S. Validation Data for Spike and Recovery Spike# 67 Sample #1 (μg/mg) 3.185 0.122 0.071 0.072 Buffer Spike Theoretical Value µg/ml 1 2 3 4 5 *Average of three 4.800 3.600 2.400 1.200 0.600 Buffer Spike Actual Value µg/ml Buffer Spike %Recovery Average Sample concentration (µg/ml)* 5.129 4.006 2.219 1.139 0.660 107 111 92 95 110 3.810 2.804 1.926 1.094 0.628 %Recovery of Sample (average) vs. Buffer Spike (actual value) 74 70 87 96 95 69 70 71 Table 6S. Validation - Dilutional Parallelism Sample #1 Sample #2 %Relative to %Relative to Average Average 1:10 77% 81% Dilution 1:20 95% 103% Dilution 1:25 110% 104% Dilution 1:40 117% 112% Dilution Sample #3 %Relative to Average Sample #4 %Relative to Average Sample #5 %Relative to Average Average of all Samples 77% 85% 82% 80% 99% 99% 100% 99% 105% 104% 106% 106% 119% 113% 111% 114%

