Part A Topological Analysis: Centrality definitions
advertisement
Part A
Topological Analysis: Centrality definitions
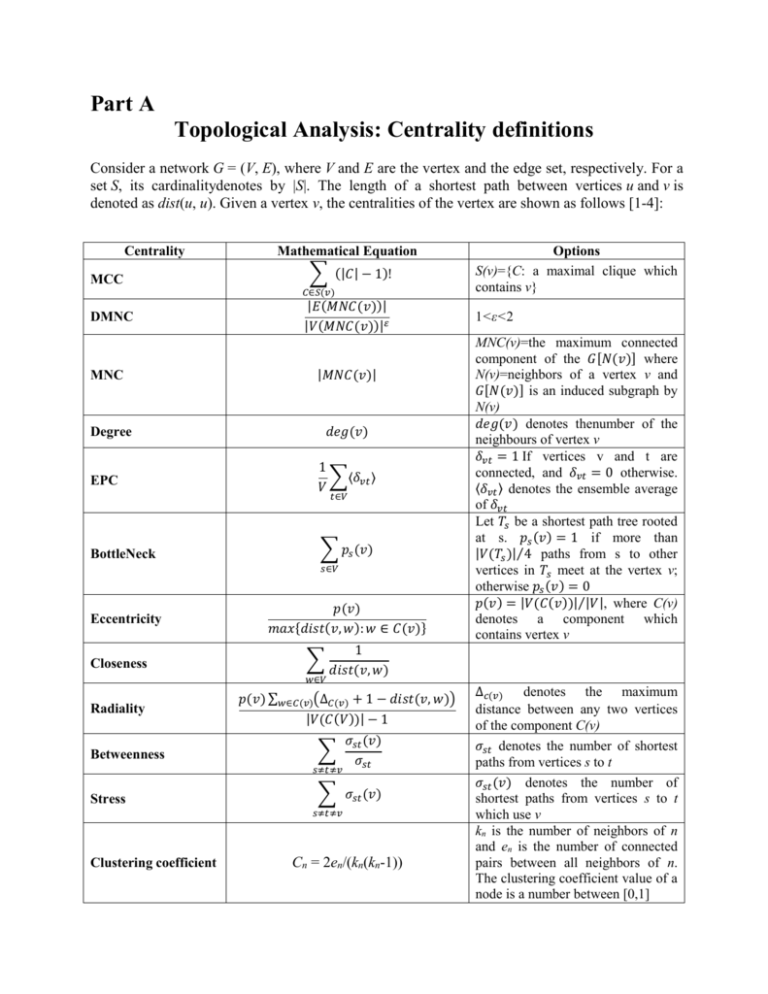
Consider a network G = (V, E), where V and E are the vertex and the edge set, respectively. For a
set S, its cardinalitydenotes by |S|. The length of a shortest path between vertices u and v is
denoted as dist(u, u). Given a vertex v, the centralities of the vertex are shown as follows [1-4]:
Centrality
MCC
Mathematical Equation
∑ (|𝐶| − 1)!
𝐶∈𝑆(𝑣)
DMNC
MNC
|𝐸(𝑀𝑁𝐶(𝑣))|
|𝑉(𝑀𝑁𝐶(𝑣))|𝜀
|𝑀𝑁𝐶(𝑣)|
𝑑𝑒𝑔(𝑣)
Degree
EPC
1
∑⟨𝛿𝑣𝑡 ⟩
𝑉
𝑡∈𝑉
BottleNeck
∑ 𝑝𝑠 (𝑣)
𝑠∈𝑉
Eccentricity
Closeness
𝑝(𝑣)
𝑚𝑎𝑥{𝑑𝑖𝑠𝑡(𝑣, 𝑤): 𝑤 ∈ 𝐶(𝑣)}
∑
𝑤∈𝑉
Radiality
Betweenness
𝑝(𝑣) ∑𝑤∈𝐶(𝑣)(∆𝐶(𝑣) + 1 − 𝑑𝑖𝑠𝑡(𝑣, 𝑤))
|𝑉(𝐶(𝑉))| − 1
∑
𝜎𝑠𝑡 (𝑣)
𝜎𝑠𝑡
∑ 𝜎𝑠𝑡 (𝑣)
𝑠≠𝑡≠𝑣
Clustering coefficient
1<ε<2
MNC(v)=the maximum connected
component of the 𝐺[𝑁(𝑣)] where
N(v)=neighbors of a vertex v and
𝐺[𝑁(𝑣)] is an induced subgraph by
N(v)
𝑑𝑒𝑔(𝑣) denotes thenumber of the
neighbours of vertex v
𝛿𝑣𝑡 = 1If vertices v and t are
connected, and 𝛿𝑣𝑡 = 0 otherwise.
⟨𝛿𝑣𝑡 ⟩ denotes the ensemble average
of 𝛿𝑣𝑡
Let 𝑇𝑠 be a shortest path tree rooted
at s. 𝑝𝑠 (𝑣) = 1 if more than
|𝑉(𝑇𝑠 )|⁄4 paths from s to other
vertices in 𝑇𝑠 meet at the vertex v;
otherwise 𝑝𝑠 (𝑣) = 0
𝑝(𝑣) = |𝑉(𝐶(𝑣))|⁄|𝑉|, where C(v)
denotes a component which
contains vertex v
1
𝑑𝑖𝑠𝑡(𝑣, 𝑤)
𝑠≠𝑡≠𝑣
Stress
Options
S(v)={C: a maximal clique which
contains v}
Cn = 2en/(kn(kn-1))
∆𝑐(𝑣) denotes the maximum
distance between any two vertices
of the component C(v)
𝜎𝑠𝑡 denotes the number of shortest
paths from vertices s to t
𝜎𝑠𝑡 (𝑣) denotes the number of
shortest paths from vertices s to t
which use v
kn is the number of neighbors of n
and en is the number of connected
pairs between all neighbors of n.
The clustering coefficient value of a
node is a number between [0,1]
1.
2.
3.
4.
Barabasi, A.L. and Z.N. Oltvai, Network biology: understanding the cell's functional organization.
Nat Rev Genet, 2004. 5(2): p. 101-13.
Watts, D.J. and S.H. Strogatz, Collective dynamics of small-world networks. Nature, 1998.
393(6684): p. 440-442.
Junker, B. and F. Schreiber, Analysis of Biological Networks. 2008: Wiley-Interscience.
Lin, C.Y., et al., Hubba: hub objects analyzer--a framework of interactome hubs identification for
network biology. Nucleic Acids Res, 2008. 36(Web Server issue): p. W438-43.
Part B
Constraint-based Analysis:
Here we have described a brief definition about four constraint-based analysis performed in the
paper [5-8].
Constraint-based analysis
Flux Balance Analysis (FBA)
Flux Variability Analysis (FVA)
Parsimonious FBA (pFBA)
Single gene deletion
1.
2.
3.
4.
Definition
FBA is mathematical method for analyzing the flow of metabolites in
a metabolic network. Representing a metabolic network as a
stoichiometric set of equations and implying the steady state, it is
possible to represent it as a stoichiometric set of equations. Since
metabolic networks typically have more reactions than metabolites,
this leads to an under-determined system of linear equations
containing more variables than equations. Using linear programming is
a standard approach to solve under-determined systems. It
minimizes/maximizes an objective function as follows:
∑ 𝑐𝑖 . |𝑣𝑖 |
Min/Max:
Subject to:
𝑆. 𝑣 = 0𝑎𝑖 < 𝑣𝑖 < 𝑏𝑖
Where c is stoichiometric coefficient of metabolite i in the reaction v.
Biological systems often contain redundancies that contribute to their
robustness. FVA could be used to examine theseredundancies by
calculating the range of numerical values for every reaction flux in a
network. This is carried out byoptimizing for a particular objective,
while still satisfying the given constraints set on the system.
pFBAis used to label all metabolic genes based on its ability to
contribute to the optimal growth rate predictions and its flux level. It
classifies as follows: essential genes, pFBA optima (which includes
genes that are predicted to be used for optimal growth), ELE(which
includes genes that will increase cellular metabolic flux if used),
MLE(which includes genes predicted to decrease the growth rate if
used), and pFBA no-flux(which includes genes that cannot be used in
the given growth conditions).
Gene deletion effect on cellular growth could be simulated similar to
linear optimization ofgrowth. The upper and lower flux bounds for the
reaction(s) corresponding to the deleted gene are both set to zero. In
the case of association of a singlegene with multiple reactions, the
gene deletion should cause removal of all associated reactions.In
addition, a reaction that could be catalyzed by multiple gene products
will not be removed in a single genedeletion.
Barabasi, A.L. and Z.N. Oltvai, Network biology: understanding the cell's functional organization.
Nat Rev Genet, 2004. 5(2): p. 101-13.
Watts, D.J. and S.H. Strogatz, Collective dynamics of small-world networks. Nature, 1998.
393(6684): p. 440-442.
Junker, B. and F. Schreiber, Analysis of Biological Networks. 2008: Wiley-Interscience.
Lin, C.Y., et al., Hubba: hub objects analyzer--a framework of interactome hubs identification for
network biology. Nucleic Acids Res, 2008. 36(Web Server issue): p. W438-43.
5.
6.
7.
8.
Mahadevan, R. and C.H. Schilling, The effects of alternate optimal solutions in constraint-based
genome-scale metabolic models. Metabolic Engineering, 2003. 5(4): p. 264-276.
Orth, J., I. Thiele, and B. Palsson, What is flux balance analysis? Nature Biotechnology, 2010.
28(3): p. 245-248.
Becker, S., et al., Quantitative prediction of cellular metabolism with constraint-based models:
the COBRA Toolbox. Nat. Protocols, 2007. 2(3): p. 727-738.
Schellenberger, J., et al., Quantitative prediction of cellular metabolism with constraint-based
models: the COBRA Toolbox v2.0. Nat Protoc, 2011. 6(9): p. 1290-307.

