Rules for Good Graphing
advertisement
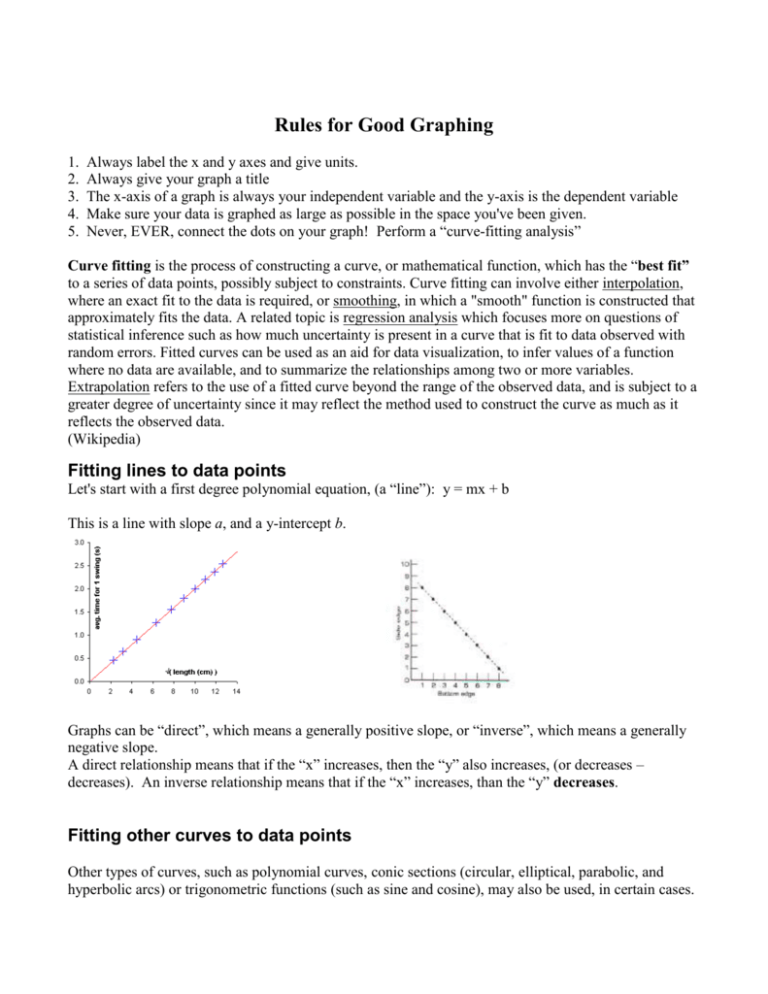
Rules for Good Graphing 1. 2. 3. 4. 5. Always label the x and y axes and give units. Always give your graph a title The x-axis of a graph is always your independent variable and the y-axis is the dependent variable Make sure your data is graphed as large as possible in the space you've been given. Never, EVER, connect the dots on your graph! Perform a “curve-fitting analysis” Curve fitting is the process of constructing a curve, or mathematical function, which has the “best fit” to a series of data points, possibly subject to constraints. Curve fitting can involve either interpolation, where an exact fit to the data is required, or smoothing, in which a "smooth" function is constructed that approximately fits the data. A related topic is regression analysis which focuses more on questions of statistical inference such as how much uncertainty is present in a curve that is fit to data observed with random errors. Fitted curves can be used as an aid for data visualization, to infer values of a function where no data are available, and to summarize the relationships among two or more variables. Extrapolation refers to the use of a fitted curve beyond the range of the observed data, and is subject to a greater degree of uncertainty since it may reflect the method used to construct the curve as much as it reflects the observed data. (Wikipedia) Fitting lines to data points Let's start with a first degree polynomial equation, (a “line”): y = mx + b This is a line with slope a, and a y-intercept b. Graphs can be “direct”, which means a generally positive slope, or “inverse”, which means a generally negative slope. A direct relationship means that if the “x” increases, then the “y” also increases, (or decreases – decreases). An inverse relationship means that if the “x” increases, than the “y” decreases. Fitting other curves to data points Other types of curves, such as polynomial curves, conic sections (circular, elliptical, parabolic, and hyperbolic arcs) or trigonometric functions (such as sine and cosine), may also be used, in certain cases. For example, trajectories of objects under the influence of gravity follow a parabolic path, when air resistance is ignored. Hence, matching trajectory data points to a parabolic curve would make sense. Tides follow sinusoidal patterns, hence tidal data points should be matched to a sine wave, or the sum of two sine waves of different periods, if the effects of the Moon and Sun are both considered. Curves can be a simple inverse of the form y = A/x, or they can be inverse square curves, y = A/x 2 , Note that it would be very difficult to visually distinguish simple inverse from inverse square. It is possible to have exponential decay or exponential growth. These can take a variety of mathematical forms. Parabolic or Sinusoidal curves would be unusual, but not impossible.


