Purpose: To prove that momentum is conserved in a collision using
advertisement
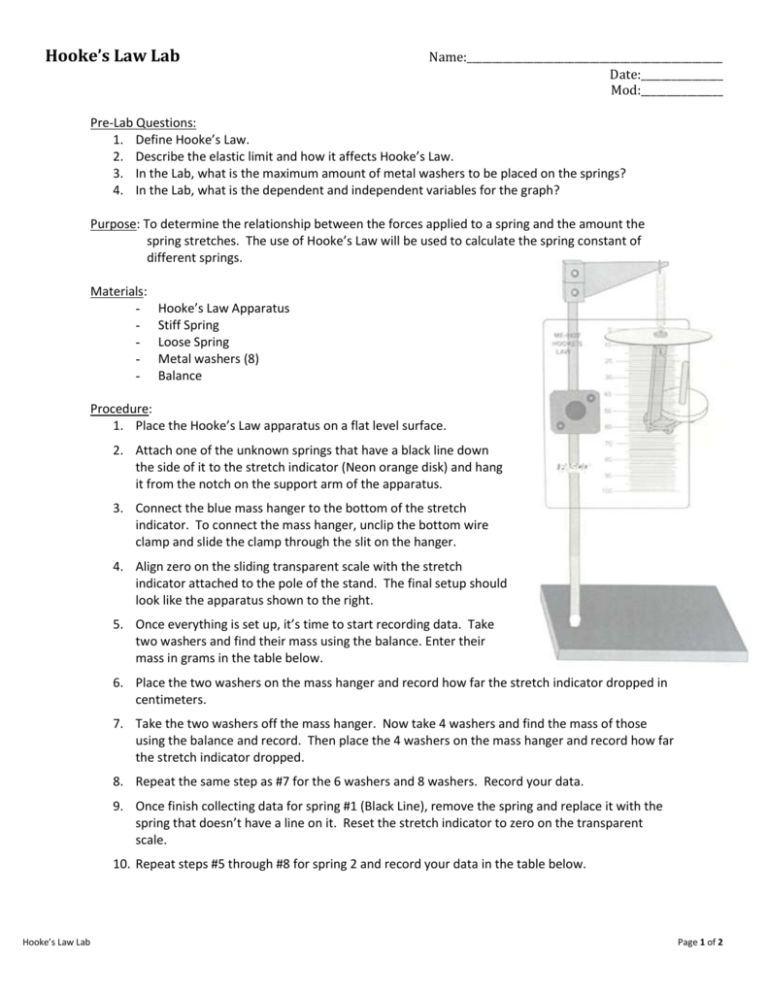
Hooke’s Law Lab Name:__________________________________________________ Date:________________ Mod:________________ Pre-Lab Questions: 1. Define Hooke’s Law. 2. Describe the elastic limit and how it affects Hooke’s Law. 3. In the Lab, what is the maximum amount of metal washers to be placed on the springs? 4. In the Lab, what is the dependent and independent variables for the graph? Purpose: To determine the relationship between the forces applied to a spring and the amount the spring stretches. The use of Hooke’s Law will be used to calculate the spring constant of different springs. Materials: - Hooke’s Law Apparatus Stiff Spring Loose Spring Metal washers (8) Balance Procedure: 1. Place the Hooke’s Law apparatus on a flat level surface. 2. Attach one of the unknown springs that have a black line down the side of it to the stretch indicator (Neon orange disk) and hang it from the notch on the support arm of the apparatus. 3. Connect the blue mass hanger to the bottom of the stretch indicator. To connect the mass hanger, unclip the bottom wire clamp and slide the clamp through the slit on the hanger. 4. Align zero on the sliding transparent scale with the stretch indicator attached to the pole of the stand. The final setup should look like the apparatus shown to the right. 5. Once everything is set up, it’s time to start recording data. Take two washers and find their mass using the balance. Enter their mass in grams in the table below. 6. Place the two washers on the mass hanger and record how far the stretch indicator dropped in centimeters. 7. Take the two washers off the mass hanger. Now take 4 washers and find the mass of those using the balance and record. Then place the 4 washers on the mass hanger and record how far the stretch indicator dropped. 8. Repeat the same step as #7 for the 6 washers and 8 washers. Record your data. 9. Once finish collecting data for spring #1 (Black Line), remove the spring and replace it with the spring that doesn’t have a line on it. Reset the stretch indicator to zero on the transparent scale. 10. Repeat steps #5 through #8 for spring 2 and record your data in the table below. Hooke’s Law Lab Page 1 of 2 11. Once all the data is collected, convert grams to kilograms and then to Newton’s. Also convert centimeters to meters in the data table. 12. Make a graph of Force vs. Displacement using Microsoft Excel or on graph paper. Record the data for spring #1 and spring #2 on the graph where force (N) is the dependent variable and displacement (m) is the independent variable. 13. Provide a key on the graph to distinguish between the two different springs. 14. Make a line of best fit for both springs. Using the slope intercept form for a linear equation, write an equation for each of the springs. Make sure to include appropriate variables, numbers, and units in the equation. All work for and equations can be placed on the graph. Data Table: Spring #1 (Black line) 2 washers 4 washers 6 washers 8 washers Mass of Mass of washers washers (g) (kg) Weight Force (N) Displacement Displacement (cm) (m) Spring Mass of Mass of #2 washers washers (No line) (g) (kg) 2 washers 4 washers 6 washers 8 washers Weight Force (N) Displacement Displacement (cm) (m) Post-Lab Questions: 1. What does the slope of the Force vs. Displacement graph show? What does the vertical intercept represent on the graph? 2. Calculate the percent error of the spring constant for each spring. The actual spring constant of spring #1 is 8 N/m and spring #2 is 5 N/m. 3. What factors do you think may have caused there to be a difference between the actual spring constant and the measured spring constant? Give at least 3 errors and explain why they cause errors to the data. Hooke’s Law Lab Page 2 of 2

