Populations Lab Page
advertisement
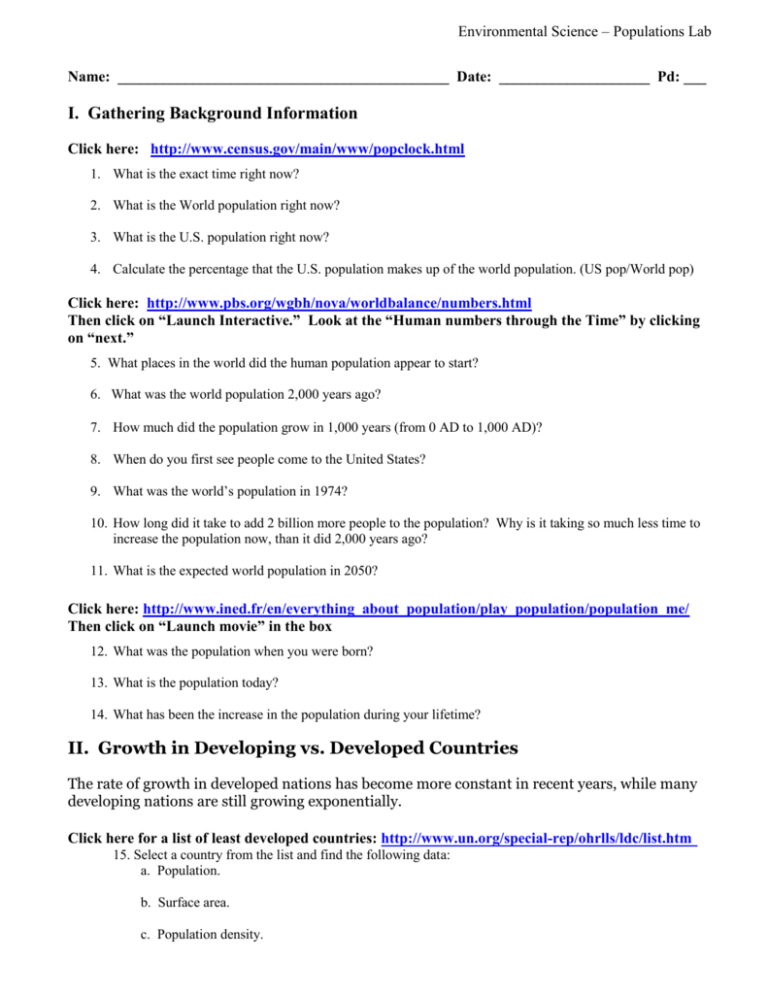
Environmental Science – Populations Lab Name: ____________________________________________ Date: ____________________ Pd: ___ I. Gathering Background Information Click here: http://www.census.gov/main/www/popclock.html 1. What is the exact time right now? 2. What is the World population right now? 3. What is the U.S. population right now? 4. Calculate the percentage that the U.S. population makes up of the world population. (US pop/World pop) Click here: http://www.pbs.org/wgbh/nova/worldbalance/numbers.html Then click on “Launch Interactive.” Look at the “Human numbers through the Time” by clicking on “next.” 5. What places in the world did the human population appear to start? 6. What was the world population 2,000 years ago? 7. How much did the population grow in 1,000 years (from 0 AD to 1,000 AD)? 8. When do you first see people come to the United States? 9. What was the world’s population in 1974? 10. How long did it take to add 2 billion more people to the population? Why is it taking so much less time to increase the population now, than it did 2,000 years ago? 11. What is the expected world population in 2050? Click here: http://www.ined.fr/en/everything_about_population/play_population/population_me/ Then click on “Launch movie” in the box 12. What was the population when you were born? 13. What is the population today? 14. What has been the increase in the population during your lifetime? II. Growth in Developing vs. Developed Countries The rate of growth in developed nations has become more constant in recent years, while many developing nations are still growing exponentially. Click here for a list of least developed countries: http://www.un.org/special-rep/ohrlls/ldc/list.htm 15. Select a country from the list and find the following data: a. Population. b. Surface area. c. Population density. Environmental Science – Populations Lab Click here: http://www.pbs.org/wgbh/nova/worldbalance/demographer.html 16. Make one observation about the fertility rates of all four countries. 17. Which country has the highest infant mortality rate? Why do you think? 18. Which countries have the lowest life expectancy? 19. Which countries have the most people under the age of 14? 20. Which country has the most migration (people coming into the country)? Why do you think? 21. Which country has the largest annual growth rate? The smallest annual growth rate? 22. What is each country’s predicted total population for 2050 (in millions of people)? III. Conclusions Go back to the US population data: http://www.census.gov/cgi-bin/popclock 23. What is the exact time right now? 24. How many minutes have elapsed since you answered question # 2? 25. What is the US population right now? 26. What was the gain in US population while you have been working on this activity? 27. What has been the gain in population per minute over this activity? Show your work. 28. According to your data, there is a net gain of 1 person every how many seconds? 29. How does this compare with the stated net gain on the census web site? IV. Demograhics Simulation LESSON 1 The Demographic Transition Open http://www.learner.org/courses/envsci/interactives/demographics/ Read Overview then click Step 1 1. Are Immigration, emigration included in the simulation? 2. Read the explanation of "Birthrate" as differently calculated from "Death rate". Most sources use the term __________________________ rate for total births per female. Note that term is used below - use the simulation "birthrate" for the data Lesson 1: Step 1 Country USA China Egypt India Italy Mexico Nigeria Fertility Rate Death Rate Population Growth 2005 Population Growth 2050 Relative place in Transition Social Factors 1 Social Factors 2 Environmental Science – Populations Lab Lesson 1: Step 2 Country USA China Egypt India Italy Shape of Pyramid: 2005 Mexico Nigeria Responses to Questions: Lesson 1 Shape of Pyramid: Simulation 2050
