Supplemental File S5. miRNAs in Humans
advertisement
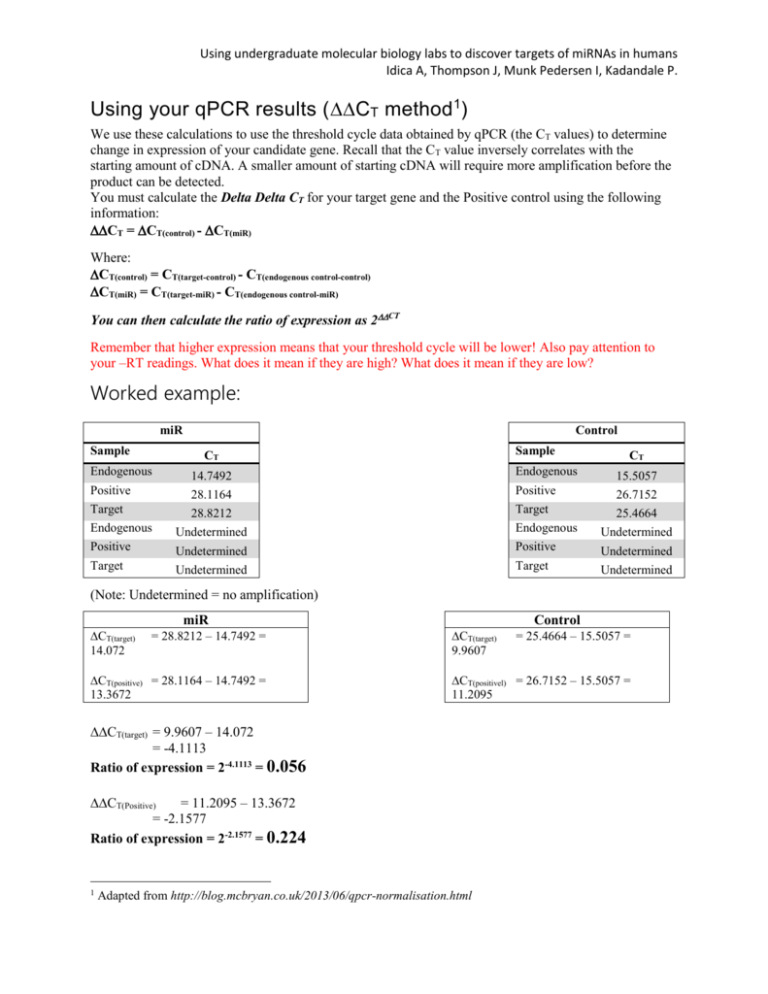
Using undergraduate molecular biology labs to discover targets of miRNAs in humans Idica A, Thompson J, Munk Pedersen I, Kadandale P. Using your qPCR results (CT method 1) We use these calculations to use the threshold cycle data obtained by qPCR (the CT values) to determine change in expression of your candidate gene. Recall that the CT value inversely correlates with the starting amount of cDNA. A smaller amount of starting cDNA will require more amplification before the product can be detected. You must calculate the Delta Delta CT for your target gene and the Positive control using the following information: CT = CT(control) - CT(miR) Where: CT(control) = CT(target-control) - CT(endogenous control-control) CT(miR) = CT(target-miR) - CT(endogenous control-miR) You can then calculate the ratio of expression as 2CT Remember that higher expression means that your threshold cycle will be lower! Also pay attention to your –RT readings. What does it mean if they are high? What does it mean if they are low? Worked example: miR Sample Control Sample CT Endogenous Positive Target CT 14.7492 Endogenous 15.5057 28.1164 Positive 26.7152 28.8212 Target 25.4664 Endogenous Undetermined Endogenous Undetermined Positive Undetermined Positive Undetermined Undetermined Target Undetermined Target (Note: Undetermined = no amplification) miR CT(target) 14.072 = 28.8212 – 14.7492 = CT(positive) = 28.1164 – 14.7492 = 13.3672 Control CT(target) 9.9607 CT(positivel) = 26.7152 – 15.5057 = 11.2095 CT(target) = 9.9607 – 14.072 = -4.1113 Ratio of expression = 2-4.1113 = 0.056 CT(Positive) = 11.2095 – 13.3672 = -2.1577 Ratio of expression = 2-2.1577 = 0.224 1 = 25.4664 – 15.5057 = Adapted from http://blog.mcbryan.co.uk/2013/06/qpcr-normalisation.html Using undergraduate molecular biology labs to discover targets of miRNAs in humans Idica A, Thompson J, Munk Pedersen I, Kadandale P. Therefore Target IS decreased by miR overexpression (positive control worked, shows decreased expression).

