Table S3. Descriptive statistics for awareness & participation in MPA
advertisement

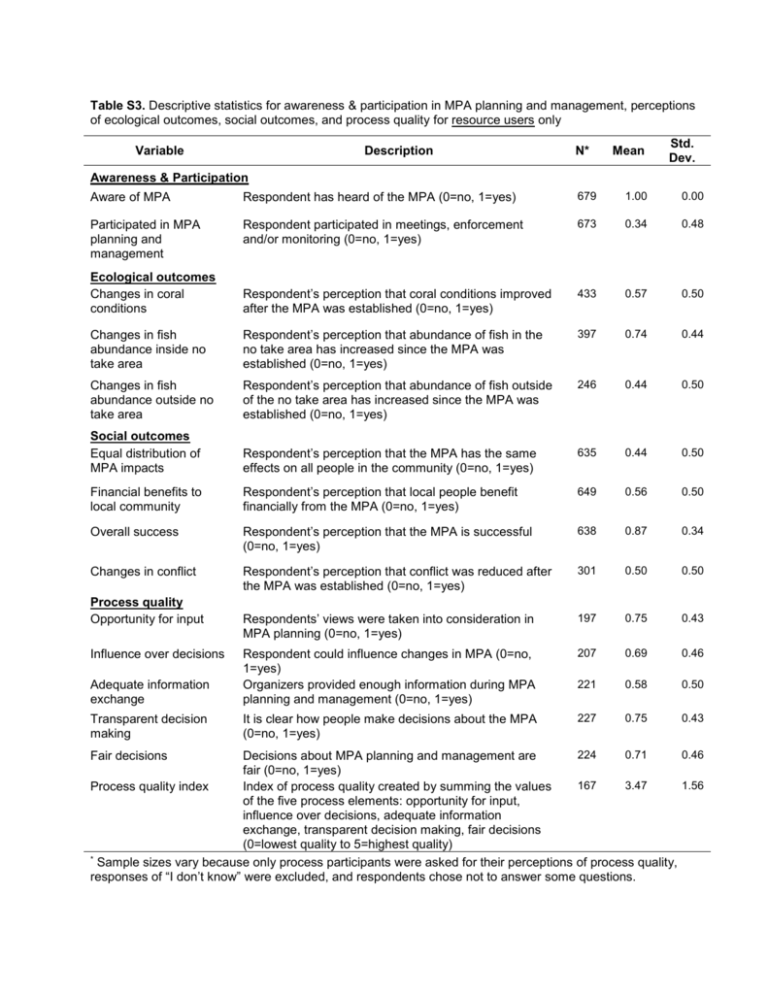
Table S3. Descriptive statistics for awareness & participation in MPA planning and management, perceptions of ecological outcomes, social outcomes, and process quality for resource users only Variable Description N* Mean Std. Dev. Awareness & Participation Aware of MPA Respondent has heard of the MPA (0=no, 1=yes) 679 1.00 0.00 Participated in MPA planning and management Respondent participated in meetings, enforcement and/or monitoring (0=no, 1=yes) 673 0.34 0.48 Ecological outcomes Changes in coral conditions Respondent’s perception that coral conditions improved after the MPA was established (0=no, 1=yes) 433 0.57 0.50 Changes in fish abundance inside no take area Respondent’s perception that abundance of fish in the no take area has increased since the MPA was established (0=no, 1=yes) 397 0.74 0.44 Changes in fish abundance outside no take area Respondent’s perception that abundance of fish outside of the no take area has increased since the MPA was established (0=no, 1=yes) 246 0.44 0.50 Social outcomes Equal distribution of MPA impacts Respondent’s perception that the MPA has the same effects on all people in the community (0=no, 1=yes) 635 0.44 0.50 Financial benefits to local community Respondent’s perception that local people benefit financially from the MPA (0=no, 1=yes) 649 0.56 0.50 Overall success Respondent’s perception that the MPA is successful (0=no, 1=yes) 638 0.87 0.34 Changes in conflict Respondent’s perception that conflict was reduced after the MPA was established (0=no, 1=yes) 301 0.50 0.50 Respondents’ views were taken into consideration in MPA planning (0=no, 1=yes) 197 0.75 0.43 207 0.69 0.46 Adequate information exchange Respondent could influence changes in MPA (0=no, 1=yes) Organizers provided enough information during MPA planning and management (0=no, 1=yes) 221 0.58 0.50 Transparent decision making It is clear how people make decisions about the MPA (0=no, 1=yes) 227 0.75 0.43 Process quality Opportunity for input Influence over decisions 224 0.71 0.46 Decisions about MPA planning and management are fair (0=no, 1=yes) 167 3.47 1.56 Process quality index Index of process quality created by summing the values of the five process elements: opportunity for input, influence over decisions, adequate information exchange, transparent decision making, fair decisions (0=lowest quality to 5=highest quality) * Sample sizes vary because only process participants were asked for their perceptions of process quality, responses of “I don’t know” were excluded, and respondents chose not to answer some questions. Fair decisions


