Probability Project – 25 points!
advertisement
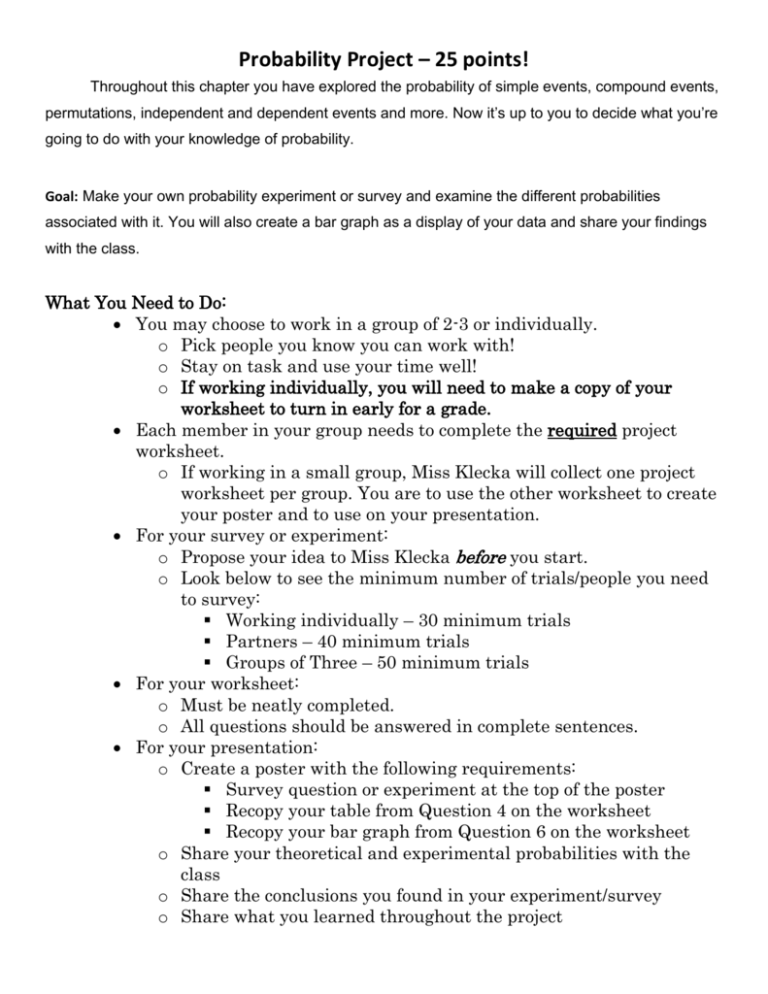
Probability Project – 25 points! Throughout this chapter you have explored the probability of simple events, compound events, permutations, independent and dependent events and more. Now it’s up to you to decide what you’re going to do with your knowledge of probability. Goal: Make your own probability experiment or survey and examine the different probabilities associated with it. You will also create a bar graph as a display of your data and share your findings with the class. What You Need to Do: You may choose to work in a group of 2-3 or individually. o Pick people you know you can work with! o Stay on task and use your time well! o If working individually, you will need to make a copy of your worksheet to turn in early for a grade. Each member in your group needs to complete the required project worksheet. o If working in a small group, Miss Klecka will collect one project worksheet per group. You are to use the other worksheet to create your poster and to use on your presentation. For your survey or experiment: o Propose your idea to Miss Klecka before you start. o Look below to see the minimum number of trials/people you need to survey: Working individually – 30 minimum trials Partners – 40 minimum trials Groups of Three – 50 minimum trials For your worksheet: o Must be neatly completed. o All questions should be answered in complete sentences. For your presentation: o Create a poster with the following requirements: Survey question or experiment at the top of the poster Recopy your table from Question 4 on the worksheet Recopy your bar graph from Question 6 on the worksheet o Share your theoretical and experimental probabilities with the class o Share the conclusions you found in your experiment/survey o Share what you learned throughout the project Probability Project Worksheet Names: _____________________________________________ 1) What are you investigating? (Are you doing a survey or an experiment? What are you trying to find?) (2 points) 2) Create a Sample Space of the different options, or outcomes, your experiment or survey has. (2 points) 3) Find the theoretical probability of each option in your sample space. (Express each answer as a fraction, decimal and percent) (3 points) 4) Make a table to record your survey/experiment results. You may want to make a rough draft and recopy a neat version of your table here. Don’t forget to label! (5 points) 5) a) Who was the population you sampled? (1 point) b) If you surveyed a different population, how do you think your results would change? If they wouldn’t, why not? (1 point) 6) Make a bar graph of the results of your survey/experiment. Don’t forget to label! (5 points) 7) Find the experimental probability of each option in your survey/experiment. (Express each answer as a fraction, decimal and percent) (3 points) 8) Compare your theoretical and experimental probabilities. (1 point) 9) What are some conclusions you can draw from your experimental probability? What did you learn? (2 points)
