Handout 10
advertisement
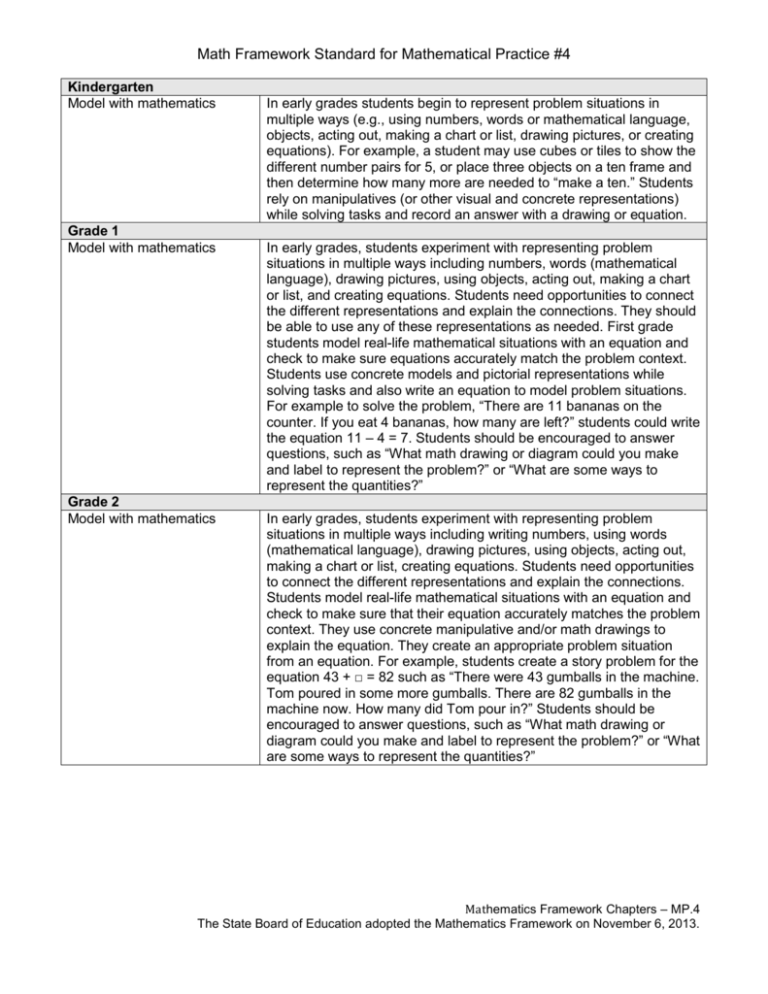
Math Framework Standard for Mathematical Practice #4 Kindergarten Model with mathematics Grade 1 Model with mathematics Grade 2 Model with mathematics In early grades students begin to represent problem situations in multiple ways (e.g., using numbers, words or mathematical language, objects, acting out, making a chart or list, drawing pictures, or creating equations). For example, a student may use cubes or tiles to show the different number pairs for 5, or place three objects on a ten frame and then determine how many more are needed to “make a ten.” Students rely on manipulatives (or other visual and concrete representations) while solving tasks and record an answer with a drawing or equation. In early grades, students experiment with representing problem situations in multiple ways including numbers, words (mathematical language), drawing pictures, using objects, acting out, making a chart or list, and creating equations. Students need opportunities to connect the different representations and explain the connections. They should be able to use any of these representations as needed. First grade students model real-life mathematical situations with an equation and check to make sure equations accurately match the problem context. Students use concrete models and pictorial representations while solving tasks and also write an equation to model problem situations. For example to solve the problem, “There are 11 bananas on the counter. If you eat 4 bananas, how many are left?” students could write the equation 11 – 4 = 7. Students should be encouraged to answer questions, such as “What math drawing or diagram could you make and label to represent the problem?” or “What are some ways to represent the quantities?” In early grades, students experiment with representing problem situations in multiple ways including writing numbers, using words (mathematical language), drawing pictures, using objects, acting out, making a chart or list, creating equations. Students need opportunities to connect the different representations and explain the connections. Students model real-life mathematical situations with an equation and check to make sure that their equation accurately matches the problem context. They use concrete manipulative and/or math drawings to explain the equation. They create an appropriate problem situation from an equation. For example, students create a story problem for the equation 43 + □ = 82 such as “There were 43 gumballs in the machine. Tom poured in some more gumballs. There are 82 gumballs in the machine now. How many did Tom pour in?” Students should be encouraged to answer questions, such as “What math drawing or diagram could you make and label to represent the problem?” or “What are some ways to represent the quantities?” Mathematics Framework Chapters – MP.4 The State Board of Education adopted the Mathematics Framework on November 6, 2013. Grade 3 Model with mathematics Grade 4 Model with mathematics Grade 5 Model with mathematics Students represent problem situations in multiple ways using numbers, words (mathematical language), drawing pictures, and objects. They might also represent a problem by acting it out or by creating charts, lists, graphs, or equations. For example, students use various contexts and a variety of models (e.g., circles, squares, rectangles, fraction bars, and number lines) to represent and develop understanding of fractions. Students use models to represent both equations and story problems and can explain their thinking. They evaluate their results in the context of the situation and reflect on whether the results make sense. Students should be encouraged to answer questions, such as “What math drawing or diagram could you make and label to represent the problem?” or “What are some ways to represent the quantities?” Students experiment with representing problem situations in multiple ways including numbers, words (mathematical language), drawing pictures, using objects, making a chart, list, or graph, and creating equations. Students need opportunities to connect the different representations and explain the connections. They should be able to use all of these representations as needed. Students should be encouraged to answer questions, such as “What math drawing or diagram could you make and label to represent the problem?” or “What are some ways to represent the quantities?” Fourth graders evaluate their results in the context of the situation and reflect on whether the results make sense. For example, a student may use an area/array rectangle model to solve the following problem by extending from multiplication to division: A fourth grade teacher bought 4 new pencil boxes. She has 260 pencils. She wants to put the pencils in the boxes so that each box has the same number of pencils. In grade five, students experiment with representing problem situations in multiple ways such as using numbers, mathematical language, drawings, pictures, objects, charts, lists, graphs and equations. Teachers might ask, “How would it help to create a diagram, chart or table?” or “What are some ways to represent the quantities?” Students need opportunities to represent problems in various ways and explain the connections. Fifth graders evaluate their results in the context of the situation and they explain whether results to problems make sense. They evaluate the utility of models they see and draw and can determine which models can be the most useful and efficient to solve problems. Mathematics Framework Chapters – MP.4 The State Board of Education adopted the Mathematics Framework on November 6, 2013. Grade 6 Model with mathematics Grade 7 Model with mathematics Grade 8 Model with mathematics In grade six, students model problem situations symbolically, graphically, in tables, contextually, and with drawings of quantities as needed. Students form expressions, equations, or inequalities from real world contexts and connect symbolic and graphical representations. Students begin to explore covariance and represent two quantities simultaneously. Students use number lines to compare numbers and represent inequalities. They use measures of center and variability and data displays (e.g., box plots and histograms) to draw inferences about and make comparisons between data sets. Students need many opportunities to connect and explain the connections between the different representations. They should be able to use any of these representations as appropriate to a problem context. Students should be encouraged to answer questions, such as “What are some ways to represent the quantities?” or “What formula might apply in this situation?” Seventh-grade students model real-world situations symbolically, graphically, in tables, and contextually. Students form expressions, equations, or inequalities from real-world contexts and connect symbolic and graphical representations. Students use experiments or simulations to generate data sets and create probability models. Proportional relationships present opportunities for modeling. For example, the number of people who live in an apartment building might be taken as proportional to the number of stories in the building for modeling purposes. Students should be encouraged to answer questions, such as “What are some ways to represent the quantities?” or “How might it help to create a table, chart, graph…?” Eighth grade students model real-world problem situations symbolically, graphically, in tables, and contextually. Working with the new concept of a function, students learn that relationships between variable quantities in the real world often satisfy a dependent relationship, in that one quantity determines the value of another. Students form expressions, equations, or inequalities from real-world contexts and connect symbolic and graphical representations. Students use scatterplots to represent data and describe associations between variables. They should be able to use any of these representations as appropriate to a problem context. Students should be encouraged to answer questions, such as “What are some ways to represent the quantities?” or “How might it help to create a table, chart, graph,…?” Mathematics Framework Chapters – MP.4 The State Board of Education adopted the Mathematics Framework on November 6, 2013.


