jbi12325-sup-0001-Appendix-S1_FINAL
advertisement

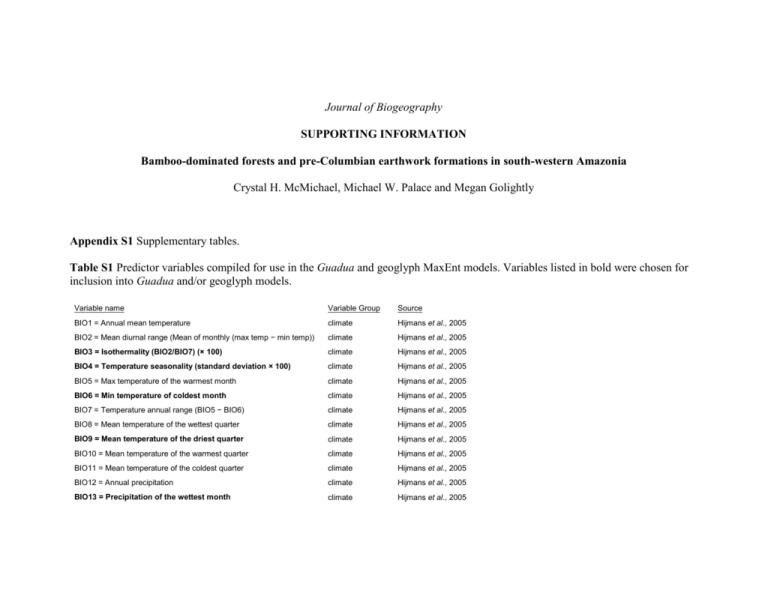
Journal of Biogeography SUPPORTING INFORMATION Bamboo-dominated forests and pre-Columbian earthwork formations in south-western Amazonia Crystal H. McMichael, Michael W. Palace and Megan Golightly Appendix S1 Supplementary tables. Table S1 Predictor variables compiled for use in the Guadua and geoglyph MaxEnt models. Variables listed in bold were chosen for inclusion into Guadua and/or geoglyph models. Variable name Variable Group Source BIO1 = Annual mean temperature climate Hijmans et al., 2005 BIO2 = Mean diurnal range (Mean of monthly (max temp − min temp)) climate Hijmans et al., 2005 BIO3 = Isothermality (BIO2/BIO7) (× 100) climate Hijmans et al., 2005 BIO4 = Temperature seasonality (standard deviation × 100) climate Hijmans et al., 2005 BIO5 = Max temperature of the warmest month climate Hijmans et al., 2005 BIO6 = Min temperature of coldest month climate Hijmans et al., 2005 BIO7 = Temperature annual range (BIO5 − BIO6) climate Hijmans et al., 2005 BIO8 = Mean temperature of the wettest quarter climate Hijmans et al., 2005 BIO9 = Mean temperature of the driest quarter climate Hijmans et al., 2005 BIO10 = Mean temperature of the warmest quarter climate Hijmans et al., 2005 BIO11 = Mean temperature of the coldest quarter climate Hijmans et al., 2005 BIO12 = Annual precipitation climate Hijmans et al., 2005 BIO13 = Precipitation of the wettest month climate Hijmans et al., 2005 BIO14 = Precipitation of the driest month climate Hijmans et al., 2005 BIO15 = Precipitation seasonality (coefficient of variation) climate Hijmans et al., 2005 BIO16 = Precipitation of the wettest quarter climate Hijmans et al., 2005 BIO17 = Precipitation of the driest quarter climate Hijmans et al., 2005 BIO18 = Precipitation of the warmest quarter climate Hijmans et al., 2005 BIO19 = Precipitation of the coldest quarter climate Hijmans et al., 2005 Elevation topographic US Geological Survey (http://eros.usgs.gov) Slope topographic Wilson et al., 2007 Roughness topographic Wilson et al., 2007 Distance to slope > 7 degrees topographic derived from SRTM in this study Distance to slope > 15 degrees topographic derived from SRTM in this study Distance to roughness >25 m topographic derived from SRTM in this study Distance to roughness >50 m topographic derived from SRTM in this study Geological province (polygon) geologic US Geological Survey (http://energy.cr.usgs.gov) Subsoil CEC (cation exchange content) edaphic FAO et al., 2008 Subsoil clay edaphic FAO et al., 2008 Subsoil gravel edaphic FAO et al., 2008 Subsoil organic carbon edaphic FAO et al., 2008 Subsoil pH edaphic FAO et al., 2008 Subsoil reference bulk density edaphic FAO et al., 2008 Subsoil sand edaphic FAO et al., 2008 Subsoil silt edaphic FAO et al., 2008 Topsoil CEC edaphic FAO et al., 2008 Topsoil Clay edaphic FAO et al., 2008 Topsoil gravel edaphic FAO et al., 2008 Topsoil organic carbon edaphic FAO et al., 2008 Topsoil pH edaphic FAO et al., 2008 Topsoil reference bulk density edaphic FAO et al., 2008 Topsoil sand edaphic FAO et al., 2008 Topsoil silt edaphic FAO et al., 2008 Distance to bamboo forest Distance to nearest geoglyph resource proximity resource proximity derived for this study derived for this study Table S2 Training and test gain assessments, which are a measure of the average likelihood for presence samples, for MaxEnt models of Guadua and geoglyphs. Training gain values are derived from points used to train the model, and test gain values are derived from occurrence points used to test the predictive capacity of the model. Training and testing gain values with (variable omitted) is the gain value of the model when the variable is excluded, and (only variable) is the gain value when the variable is used as a single predictor. *(g−) models are those with the ‘distance to nearest geoglyph’ predictor variable omitted, and (g+) models are those with the ‘distance to nearest geoglyph’ variable included. (b−) models are those omitting the ‘distance to bamboo’ predictor, and (b+) models are those including ‘distance to bamboo’. Variable name BIO3 = Isothermality (BIO2/BIO7) (* 100) BIO4 = Temperature Seasonality (standard deviation *100) BIO6 = Min Temperature of Coldest Month BIO9 = Mean Temperature of Driest Quarter BIO13 = Precipitation of Wettest Month BIO14 = Precipitation of Driest Month BIO15 = Precipitation Seasonality (Coefficient of Variation) BIO17 = Precipitation of Driest Quarter BIO 18 = Precipitation of warmest quarter Elevation Training gain (variable omitted) Guadua Guadua Geo (g-) (g+) (-b) Geo (+b) Training gain (only variable) Guadua Guadua (g-) (g+) Geo (-b) Geo (+b) Test gain (variable omitted) Guadua Guadua (g-) (g+) Geo (-b) Geo (+b) Test gain (only variable) Guadua Guadua Geo (g-) (g+) (-b) Geo (+b) 2.03 2.04 3.33 3.40 0.20 0.20 1.33 1.33 1.63 1.56 3.36 3.42 0.14 0.14 1.40 1.40 1.94 1.95 3.32 3.39 0.52 0.52 1.61 1.61 1.47 1.41 3.38 3.43 0.48 0.48 1.63 1.63 2.00 2.01 3.34 3.40 0.60 0.60 1.75 1.75 1.55 1.54 3.39 3.44 0.65 0.65 1.83 1.83 2.03 2.04 3.33 3.39 0.51 0.51 0.95 0.95 1.64 1.57 3.39 3.43 0.49 0.49 1.00 1.00 2.01 2.02 3.33 3.40 0.03 0.03 1.44 1.44 1.60 1.52 3.39 3.44 -0.02 -0.02 1.50 1.50 2.01 2.02 3.33 3.40 0.23 0.23 1.37 1.37 1.59 1.55 3.39 3.44 0.20 0.20 1.43 1.43 2.03 2.04 3.34 3.40 0.30 0.30 1.73 1.73 1.63 1.54 3.39 3.44 0.33 0.33 1.92 1.92 2.03 2.04 3.32 3.39 0.23 0.23 1.69 1.69 1.63 1.55 3.38 3.43 0.21 0.21 1.76 1.76 2.00 2.02 3.34 3.40 0.54 0.54 1.90 1.90 1.58 1.56 3.40 3.44 0.55 0.55 2.01 2.01 2.00 2.01 3.34 3.40 0.37 0.37 0.79 0.79 1.54 1.48 3.40 3.44 0.38 0.38 0.84 0.84 Geological province (polygon) Distance to roughness >25 m Distance to roughness >50 m Roughness Subsoil reference bulk density Subsoil CEC (cation exchange content) Subsoil gravel Subsoil Organic Carbon Subsoil pH Subsoil silt Topsoil organic carbon Distance to geoglyph/bamb oo forest* 1.95 1.97 3.32 3.40 1.15 1.15 2.01 2.01 1.56 1.46 3.38 3.44 1.23 1.23 2.04 2.04 1.86 1.88 3.28 3.37 0.32 0.32 0.51 0.51 1.42 1.37 3.35 3.40 0.30 0.30 0.52 0.52 1.97 1.99 3.33 3.40 0.28 0.28 0.71 0.71 1.58 1.54 3.38 3.43 0.25 0.25 0.73 0.73 2.03 2.04 3.33 3.39 0.11 0.11 0.14 0.14 1.64 1.59 3.38 3.42 0.12 0.12 0.15 0.15 2.01 2.02 3.34 3.40 0.12 0.12 1.12 1.12 1.56 1.51 3.39 3.44 0.13 0.13 1.64 1.64 2.03 2.04 3.32 3.39 0.43 0.43 1.13 1.13 1.62 1.58 3.38 3.43 0.41 0.41 1.46 1.46 2.02 2.03 3.34 3.40 0.12 0.12 1.36 1.36 1.76 1.71 3.39 3.43 -0.07 -0.07 1.74 1.74 2.03 2.04 3.34 3.40 0.08 0.08 1.47 1.47 1.64 1.56 3.39 3.44 0.04 0.04 1.97 1.97 2.03 2.04 3.34 3.40 0.06 0.06 0.72 0.72 1.65 1.59 3.39 3.44 0.07 0.07 1.16 1.16 2.03 2.04 3.33 3.40 0.26 0.26 1.42 1.42 1.62 1.55 3.38 3.43 0.30 0.30 1.91 1.91 2.02 2.03 3.34 3.40 0.06 0.06 1.97 1.97 1.61 1.57 3.40 3.44 0.05 0.05 2.70 2.70 2.03 3.34 0.59 2.21 1.64 3.39 0.59 2.23 Table S3 AUC values, which evaluate model fit, with higher values indicating better-fit models for MaxEnt models of Guadua and geoglyphs. AUC values with (variable omitted) is the AUC value of the model when the variable is excluded, and (only variable) is the AUC value when the variable is used as a single predictor.*(g−) models are those with the ‘distance to nearest geoglyph’ predictor variable omitted, and (g+) models are those with the ‘distance to nearest geoglyph’ variable included. (b−) models are those omitting the ‘distance to bamboo’ predictor, and (b+) models are those including ‘distance to bamboo’. Variable name BIO3 = Isothermality (BIO2/BIO7) (* 100) AUC (variable omitted) Guadua Guadua (g-) (g+) AUC (only variable) Guadua Guadua (g-) (g+) Geo(-b) Geo(+b) Geo(-b) Geo(+b) 0.92 0.92 0.99 0.99 0.68 0.68 0.90 0.90 BIO4 = Temperature Seasonality (standard deviation *100) 0.91 0.91 0.99 0.99 0.78 0.78 0.93 0.93 BIO6 = Min Temperature of Coldest Month 0.92 0.92 0.99 0.99 0.82 0.82 0.94 0.94 BIO9 = Mean Temperature of Driest Quarter 0.92 0.92 0.99 0.99 0.78 0.78 0.87 0.87 BIO13 = Precipitation of Wettest Month 0.92 0.92 0.99 0.99 0.58 0.58 0.92 0.92 BIO14 = Precipitation of Driest Month 0.92 0.92 0.99 0.99 0.69 0.69 0.91 0.91 BIO15 = Precipitation Seasonality (Coefficient of Variation) 0.92 0.92 0.99 0.99 0.74 0.74 0.94 0.94 BIO17 = Precipitation of Driest Quarter 0.92 0.92 0.99 0.99 0.69 0.69 0.94 0.94 BIO 18 = Precipitation of warmest quarter 0.92 0.92 0.99 0.99 0.79 0.79 0.94 0.94 Elevation 0.92 0.92 0.99 0.99 0.69 0.69 0.84 0.84 Geological province (polygon) 0.92 0.91 0.99 0.99 0.89 0.89 0.94 0.94 Distance to roughness >25 m 0.91 0.91 0.99 0.99 0.71 0.71 0.76 0.76 Distance to roughness >50 m 0.92 0.92 0.99 0.99 0.70 0.70 0.82 0.82 Roughness 0.92 0.92 0.99 0.99 0.64 0.64 0.64 0.64 Subsoil reference bulk density 0.92 0.92 0.99 0.99 0.63 0.63 0.93 0.93 Subsoil CEC (cation exchange content) 0.92 0.92 0.99 0.99 0.73 0.73 0.92 0.92 Subsoil gravel 0.93 0.93 0.99 0.99 0.65 0.65 0.87 0.87 Subsoil Organic Carbon 0.92 0.92 0.99 0.99 0.66 0.66 0.91 0.91 Subsoil pH 0.92 0.92 0.99 0.99 0.52 0.52 0.89 0.89 Subsoil silt 0.92 0.92 0.99 0.99 0.71 0.71 0.93 0.93 Topsoil organic carbon 0.92 0.92 0.99 0.99 0.58 0.58 0.96 0.96 Distance to geoglyph/bamboo forest* 0.92 0.99 0.80 0.96


