MPM 1D1 Linear Relations Course Timeline - St. Ignatius
advertisement
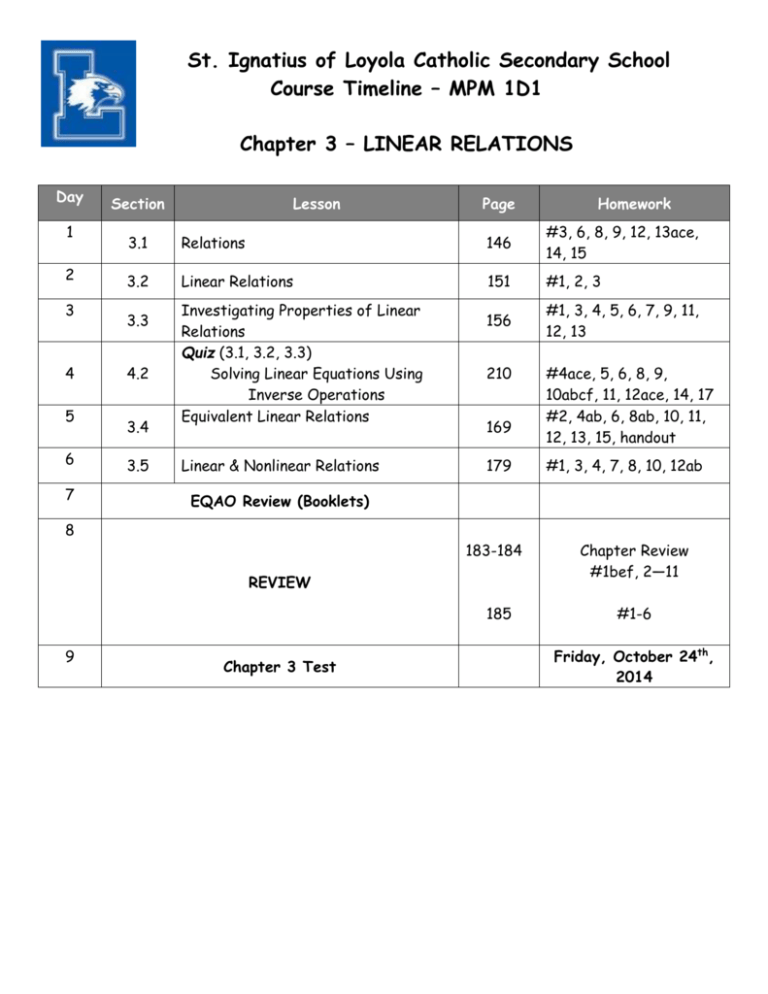
St. Ignatius of Loyola Catholic Secondary School Course Timeline – MPM 1D1 Chapter 3 – LINEAR RELATIONS Day 1 2 3 4 5 6 7 Section Lesson Page 3.1 Relations 146 #3, 6, 8, 9, 12, 13ace, 14, 15 3.2 Linear Relations 151 #1, 2, 3 156 #1, 3, 4, 5, 6, 7, 9, 11, 12, 13 3.3 4.2 3.4 3.5 Investigating Properties of Linear Relations Quiz (3.1, 3.2, 3.3) Solving Linear Equations Using Inverse Operations Equivalent Linear Relations Linear & Nonlinear Relations 210 169 179 #4ace, 5, 6, 8, 9, 10abcf, 11, 12ace, 14, 17 #2, 4ab, 6, 8ab, 10, 11, 12, 13, 15, handout #1, 3, 4, 7, 8, 10, 12ab EQAO Review (Booklets) 8 183-184 REVIEW 185 9 Homework Chapter 3 Test Chapter Review #1bef, 2—11 #1-6 Friday, October 24th, 2014 MPM1D – LEARNING GOALS Chapter 3 – Linear Relations Lesson 3.1 - Relations Goal: I will be able to represent a relation with two variables using a table of values, a graph, and an equation. Lesson 3.2 – Linear Relations Goal: I will be able to tell the difference between relationships that have a direct variation and a partial variation through a table of values, a graph and its equation. Lesson 3.3 –Investigating Properties of Linear Relations Goal: I will be able to identify a linear relation from a chart, by graphing and observing the change in the rise vs the run. I will be able to draw a line using a table of values. Lesson 4.2 - Solving Linear Equations Using Inverse Operations Goal: I will be able to find what x equals in an equation by isolating for x (get x by itself). I will be able to check my solution by substituting x back into the equation and making sure left side = right side Lesson 3.4 – Equivalent Linear Relations Goal: I will be able to represent a linear relation in different forms (Ax + By = C, y = mx + b, Ax + By + C = D). I will be able to identify the x and y intercepts of a linear relation and graph points using rise/run. Lesson 3.5 – Linear & Nonlinear Relations Goal: I will be able to notice the difference between a linear and non-linear relationship by observing its table of values, its graph and the degree of its equation.


