Magnetic induction
TEP
Related Topics
Maxwell’s equations, electrical eddy field, magnetic field of coils, coil, magnetic flux, induced voltage
Principle
A magnetic field of variable frequency and varying strength is produced in a long coil. The voltages
induced across thin coils which are pushed into the long coil are measured depending on the frequency
of the current in the field coil and the strength of its magnetic field as well as the number of turns and the
diameter of the induction coil.
Material
1
1
1
1
1
1
Field coil, 750 mm, 485 turns/m
Induction coil, 300 turns, 𝑑 = 40 mm
Induction coil, 300 turns, 𝑑 = 32 mm
Induction coil, 300 turns, 𝑑 = 25 mm
Induction coil, 200 turns, 𝑑 = 40 mm
Induction coil, 100 turns, 𝑑 = 40 mm
11001-00
11006-01
11006-02
11006-03
11006-04
11006-05
1
1
1
2
3
2
Induction coil, 150 turns, 𝑑 = 25 mm
Induction coil, 75 turns, 𝑑 = 25 mm
Digital function generator
Multi-range meter, analogue
Connecting cord, 𝑙 = 750 mm, red
Connecting cord, 𝑙 = 750 mm, blue
11006-06
11006-07
13654-99
07126-00
07362-01
07362-04
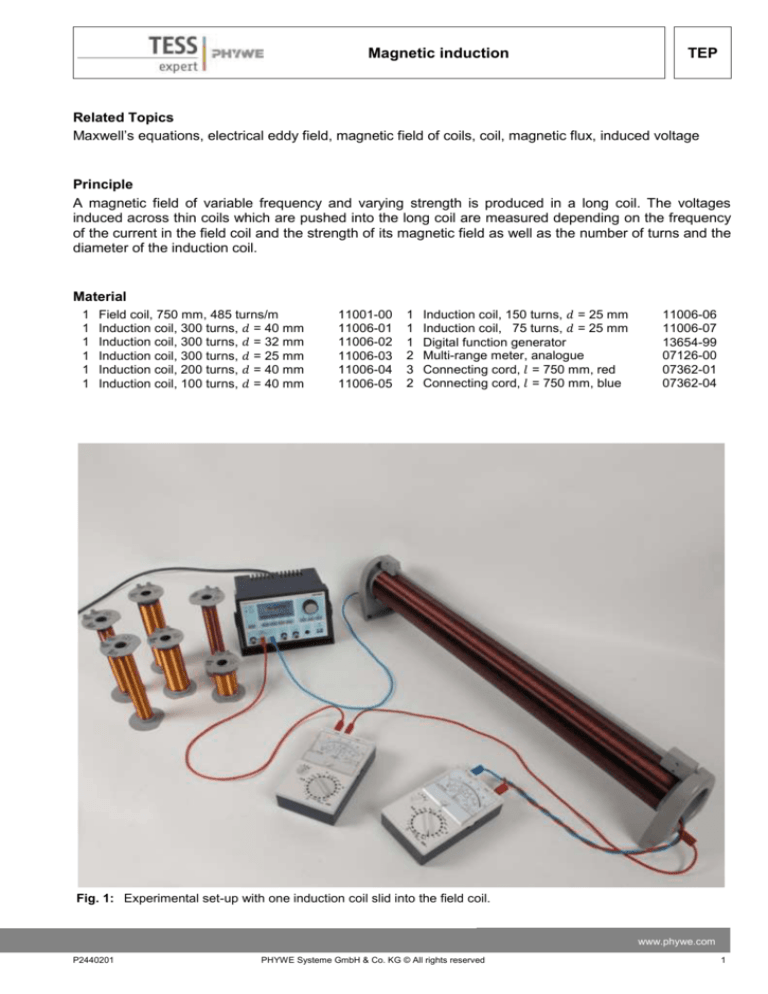
Fig. 1: Experimental set-up with one induction coil slid into the field coil.
www.phywe.com
P2440201
PHYWE Systeme GmbH & Co. KG © All rights reserved
1
Magnetic induction
TEP
Tasks
Measure the induction voltage as a function of
1. the current in the field coil at a constant frequency,
2. the frequency of the magnetic field at a constant current,
3. the number of turns of the induction coil at constant frequency and current and
4. the cross-sectional area of the induction coil at constant frequency and current.
Set-up
The experimental set-up is as shown in fig. 1. One digital multi-range meter is set up in series connection
to the field coil and the digital frequency generator in order to measure the current in the field coil. The
second multi-range meter is connected to the induction coil to measure the induced voltage.
Procedure
Set both multi-range meter to AC (alternating current) mode. For the measurements choose ranges up to
300 mA and up to 3 V respectively. Be careful to read the correct scales for the measurements.
For a detailed description of the operation of the digital function generator please refer to the manual.
Task 1:
Tune the current in the field coil by turning up the amplitude of the sinus signal of the digital frequency
generator. Start with an amplitude of 0.5 V and increase to a maximum of 10 V in steps of 0.5 V.
Task 2:
Choose the current in the field coil between 20 and 40 mA. The effect of frequency should be studied
between 1 kHz and 12 kHz, since below 0.5 kHz the coil practically represents a short circuit and above
12 kHz the accuracy cannot be guaranteed. Increase the frequency in steps of 0.5 kHz. In order to
maintain a constant current in the field coil for various frequencies, you have to adjust the amplitude of
the sinus signal very accurately for each frequency.
Task 3 and 4:
Choose frequency and signal-amplitude and maintain these settings throughout the measurements. Note
down the induced voltage, number of turns and diameter for each induction coil.
Theory
To understand the fundamentals of this experiment, two cases must be considered. First we treat the
temporal variation of the magnetic flux through an area which induces a voltage in a conductor. In this
experiment, this voltage will be measured. Second the temporal variation of a current in a conductor,
which induces a magnetic field, will be regarded whereby the current is the second measurand.
The temporal variation of the magnetic flux leads to Faraday's law of induction. The magnetic flux 𝜙
⃗ over this area (1).
through an area 𝐴 is obtained by integrating the magnetic flux density 𝐵
⃗ ⃗⃗⃗⃗⃗
𝜙 = ∫𝐴 𝐵
𝑑𝐴
(1)
After the law of induction the temporal variation of the flux 𝜙 induces the voltage 𝑈𝑖𝑛𝑑 (2). Considering
the flux 𝜙 through 𝐴 which is enclosed by a conductor loop, the induced voltage is the integral of the
electric field 𝐸⃗ in the conductor loop over the area’s boundary 𝐶.
2
PHYWE Systeme GmbH & Co. KG © All rights reserved
P2440201
Magnetic induction
𝜕𝜙
⃗⃗⃗⃗
𝑈𝑖𝑛𝑑 = − 𝜕𝑡 = ∮𝐶 𝐸⃗ 𝑑𝑠
TEP
(2)
This relationship for one conductor loop is the second of Maxwell’s equations.
For 𝑛 parallel conductor loops equation (3) is valid, if 𝜙 is the same for all loops.
𝑈𝑖𝑛𝑑 = − 𝑛 ∙
𝜕𝜙
𝜕𝑡
(3)
Now we have a relation between the induced voltage and the number of coils. We need to find a way to
calculate the right side of equation (3). Therefore we consider the magnetic flux density in a long coil,
which is constant, so that equation (1) simplifies to the following relation.
⃗ ∫ ⃗⃗⃗⃗⃗
⃗ ∙ ⃗⃗⃗𝐴
𝜙= 𝐵
𝑑𝐴 = 𝐵
𝐴
(4)
⃗ which depends only on measurands
Utilizing Maxwell’s first equation, we can find an expression for 𝐵
and fundamental constants.
Maxwell’s first equation (5) states that in a conductor a current generates a magnetic field, of which the
closed field lines circle around the currents.
⃗ ⃗⃗⃗⃗
𝑑𝐴 = 1⁄𝜇 ∙ ∮C′ 𝐵
𝑑𝑠
∫𝐴′ 𝑗⃗ ∙ ⃗⃗⃗⃗⃗
(5)
There 𝜇 is the magnetic conductivity (a material’s constant), 𝐶′ is the inductor coil which is penetrated by
⃗ and encloses the area 𝐴′. In the field coil flows a current 𝐼 which
the field coil’s magnetic field density 𝐵
is given by integrating the inductor coil’s area 𝐴 over the current density 𝑗⃗ , so 𝐼 = ∫𝐴 𝑗⃗ ∙ ⃗⃗⃗⃗⃗
𝑑𝐴 .
⃗ can be approximated by the following equation:
For a long coil with 𝑛 turns the absolute value of 𝐵
𝐵 = 𝑛 ∙ 𝜇 ∙ 𝐼⁄l
(6)
There, 𝑙 is the length of the coil which must be significant higher than the diameter. In air, 𝜇 can be
approximated by the magnetic constant
𝜇0 = 4 𝜋 ∙ 10−7 V ∙ s ∙ A−1 ∙ m−1 .
(7)
If an alternating current 𝐼(𝑡) = 𝐼0 ∙ sin(𝜔𝑡) with the frequency 𝜈 = 𝜔⁄2𝜋 flows through the field coil, then
from (6) the field density in the field coil is a function of time and alternates in phase with the current:
𝐵(𝑡) =
𝑛 𝜇0
𝑙
∙ 𝐼0 ∙ sin(2𝜋 𝜈 ∙ 𝑡)
(8)
The induced voltage can be calculated by applying equation (6) to equations (3) and (4). Execution of
the time derivation gives the following relation for the induced voltage
www.phywe.com
P2440201
PHYWE Systeme GmbH & Co. KG © All rights reserved
3
Magnetic induction
TEP
𝑈𝑖𝑛𝑑 (𝑡) = − 𝑛′ 𝐴′ ∙
𝜕𝐵(𝑡)
𝜕𝑡
= − 𝑛′ 𝐴′ ∙ 2𝜋 𝜈
𝑛 𝜇0
𝑙
∙ 𝐼0 ∙ cos(2𝜋 𝜈 ∙ 𝑡),
(9)
where 𝑛′ is the induction coil’s number of turns and 𝐴′ its cross-sectional area. The induced voltage
alternates with the same frequency as the current but is phase-shifted by 𝜋⁄2 .
Evaluation and results
In the following the evaluation of the obtained values is described with the help of example values. Your
results may vary from those presented here.
Task 1: Measure the induction voltage as a function of the current in the field coil at a frequency of 10.7
kHz and calculate the magnetic constant 𝜇0 .
In order to vary the magnetic field the current in the field coil has to be altered. With relation (6) the
magnetic constant can be calculated if the current and the magnetic field are known. In this experiment
the magnetic field is not measured so we need to find another way. Therefore we consider relation (9).
As is easily shown (see equation 10) the magnetic field constant is included in the slope 𝑠 of the induced
voltage’s linear dependence of the current.
𝑈𝑖𝑛𝑑 (𝑡) = − 𝑛′ 𝐴′ ∙ 2𝜋 𝜈 ∙
𝑛 𝜇0
∙
𝑙
cos(2𝜋 𝜈 ∙ 𝑡) ∙ 𝐼0 = 𝑠(𝑡) ∙ 𝐼0
(10)
The time-dependence can be disregarded, if we always measure current and voltage in intervals of one
period = 1⁄𝜈 . Insertion in relation (10) gives
𝑈𝑖𝑛𝑑 = − 𝑛′ 𝐴′ ∙ 2𝜋 𝜈 ∙
𝑛 𝜇0
𝑙
∙ 𝐼0
(11)
as the cosine-function simply reduces to unity. With equation (11) all other contributions to 𝑠 are known
from the specifics of the used coils and we can calculate μ0 .
Fitting the measurements to a linear function (see Fig. 2) gives equation (12) with the correlation
coefficient 𝑅 = 0.9982.
𝑈𝑖𝑛𝑑 ⁄mV = 62.2 + 21.9 ∙ 𝐼0 /mA
(12)
As can be seen in fig. 2 for very small fields, the measured values differ from the expected values and
the induced voltage tends towards zero. For any currents greater than 3 mA the dependence is indeed
linear and the experimental results are well described by equation (12).
For the slope 𝑠 we obtain from equations (11) and (12):
𝑠 = 𝑛′ 𝐴′ ∙ 2𝜋 𝜈 ∙
𝑛
𝑙
∙ 𝜇 0 = 21. 9
Vs
From the experiment we calculate μ0 = 1.78 ∙ 10−6 Am, which is of the same order as the value given in
Vs
the literature with 𝜇0𝑙𝑖𝑡 = 1.26 ∙ 10−6 Am.
4
PHYWE Systeme GmbH & Co. KG © All rights reserved
P2440201
Magnetic induction
TEP
Fig. 3: The graph shows the induced voltage for different frequency at a field strength of 18 µT in the
field coil (blue). The dependence follows relation (13). The red line indicates the theoretically
expected values.
Task 2: Measure the induction voltage as a function of the frequency of the magnetic field at constant
current.
As can be seen from equation (11) the induced
voltage depends linearly on the frequency of the
magnetic field and the current in the field coil
respectively.
Measurements were done at a current of 30 mA
which corresponds to a field strength of
approximately 18.3 μT in the field coil.
Fitting the measurements to a linear function (see
Fig. 3) gives equation (13) with the correlation
coefficient 𝑅 = 0.9984 and a slope 𝑠𝑓𝑖𝑡 = 40 ± 8.
𝑈𝑖𝑛𝑑 ⁄mV = 40 𝜈⁄kHz + 9
(13)
If we calculate the slope with the known values for
the field coil, induction coil and current, we obtain the
theoretical value for the slope with
𝑠𝑐𝑎𝑙𝑐 = 43.2 ,
which is well within error limits.
Fig. 4: induced voltage for different coils with a
diameter of 26 mm following relation (14).
www.phywe.com
P2440201
PHYWE Systeme GmbH & Co. KG © All rights reserved
5
Magnetic induction
TEP
Task 3: Measure the induction voltage as a function
of the number of turns of the induction coil at
constant frequency and current.
Measurements were done at 10.7 kHz and 30 mA.
All induction coils with diameters of 26 mm and
41 mm were studied.
Fitting the measured values for the coils with a
diameter 𝑑 = 26 mm to a linear function gives
relation (14) corresponding to Fig. 4.
𝑈𝑖𝑛𝑑 ⁄mV = 0.899 ∙ 𝑛′ − 46
(14)
with the correlation 𝑅 = 0.9985.
With a greater diameter we can reach significantly
higher induction voltages as Fig. 5 easily shows.
Fig. 5: induced voltage for different coils with a
diameter of 41 mm following relation (15).
Fitting the measured values for the coils with a
diameter 𝑑 = 41 mm to a linear function gives
relation (15)
𝑈𝑖𝑛𝑑 ⁄mV = 2.78 ∙ 𝑛′ − 100
(15)
with a slightly better correlation of 𝑅 = 0.9989.
Task 4: Measure the induction voltage as a function of the cross-sectional area of the induction coil at
constant frequency and current.
The cross-sectional area is the circular area enclosed by the coil. With relation (16) we can calculate the
cross-sectional area with the known diameter.
𝐴′ = 𝜋⁄4 ∙ 𝑑2
(16)
Measurements were done at 10.7 kHz and 30 mA.
All induction coils with 300 turns were used in this
experiment. Figure 6 shows the obtained values
which were fitted to a linear function as in equation
(17).
𝑈𝑖𝑛𝑑 ⁄mV = 0.643 ∙ A⁄mm² − 100
(17)
The correlation is quite high with 𝑅 = 0.9992.
Fig. 6: Induced voltage for various coils with 300 turns.
The dependence of the cross-sectional area
follows relation (17).
6
PHYWE Systeme GmbH & Co. KG © All rights reserved
P2440201

