SPAmeltpaper_SupplementaryMaterials
advertisement
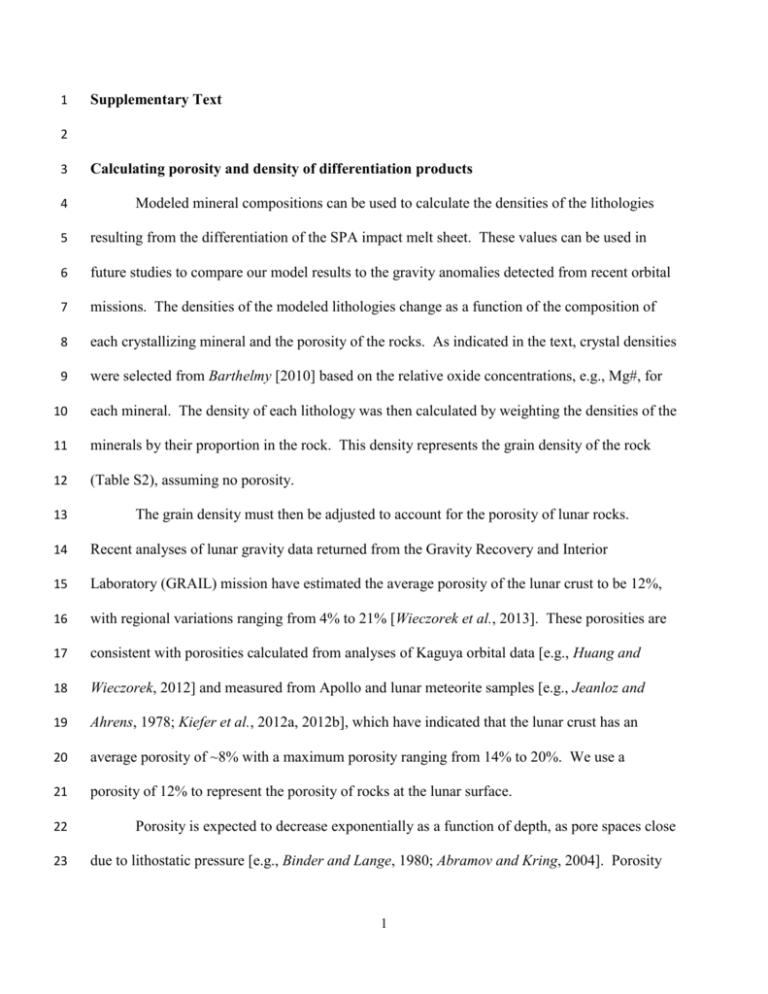
1 Supplementary Text 2 3 4 Calculating porosity and density of differentiation products Modeled mineral compositions can be used to calculate the densities of the lithologies 5 resulting from the differentiation of the SPA impact melt sheet. These values can be used in 6 future studies to compare our model results to the gravity anomalies detected from recent orbital 7 missions. The densities of the modeled lithologies change as a function of the composition of 8 each crystallizing mineral and the porosity of the rocks. As indicated in the text, crystal densities 9 were selected from Barthelmy [2010] based on the relative oxide concentrations, e.g., Mg#, for 10 each mineral. The density of each lithology was then calculated by weighting the densities of the 11 minerals by their proportion in the rock. This density represents the grain density of the rock 12 (Table S2), assuming no porosity. 13 The grain density must then be adjusted to account for the porosity of lunar rocks. 14 Recent analyses of lunar gravity data returned from the Gravity Recovery and Interior 15 Laboratory (GRAIL) mission have estimated the average porosity of the lunar crust to be 12%, 16 with regional variations ranging from 4% to 21% [Wieczorek et al., 2013]. These porosities are 17 consistent with porosities calculated from analyses of Kaguya orbital data [e.g., Huang and 18 Wieczorek, 2012] and measured from Apollo and lunar meteorite samples [e.g., Jeanloz and 19 Ahrens, 1978; Kiefer et al., 2012a, 2012b], which have indicated that the lunar crust has an 20 average porosity of ~8% with a maximum porosity ranging from 14% to 20%. We use a 21 porosity of 12% to represent the porosity of rocks at the lunar surface. 22 23 Porosity is expected to decrease exponentially as a function of depth, as pore spaces close due to lithostatic pressure [e.g., Binder and Lange, 1980; Abramov and Kring, 2004]. Porosity 1 24 variations with depth can be calculated for the lunar crust using the following equation [Binder 25 and Lange, 1980]: 26 𝑧 ɸ(𝑧) = ɸ𝑜 exp (− 𝐾) , (S1) 27 where ɸo is the porosity of surface rocks (12%), z is the depth in the lunar interior, and K is the 28 porosity decay constant (~6.5 km for the Moon, [Abramov and Kring, 2005]). Porosities 29 expected for the solidified SPA impact melt sheet are shown in Table S2. Note that the final 30 compositions noted in the table represent the final reasonable compositions from the model and 31 correspond to depths of 3 km and 4 km for scenarios 1a and 3a, respectively. 32 33 34 These porosities can be used to calculate the density of each lithology, including any pore space. This density can be calculated with the following equation [e.g., Kiefer et al., 2012a]: ρgrain+porosity = ρgrain (1 − 𝑃) , (S2) 35 where P is the porosity. The resulting ρ(grain+porosity) for each lithology is shown in Table S2. 36 Results indicate that the basal ultramafic layers of scenario 1a have densities ranging from 3.4– 37 3.5 g cm-3 and that the upper gabbroic and noritic layers of scenario 1a have densities ranging 38 from 3.1–3.3 g cm-3. Results for scenario 3a indicate densities ranging from 3.4–3.5 g cm-3 for 39 the basal ultramafic layers and from 2.9–3.2 g cm-3 for the upper gabbroic and noritic layers. 40 The lower dunite and pyroxenite layers had very little porosity (~0.01%) while the porosity 41 increased to 3%–12% in the shallower layers. 42 Alternatively, the pore spaces may have partially filled with melt if the porosity had 43 developed due to crystal settling during melt solidification. Pore spaces completely filled with 44 melt represent an upper limit for the density of each lithology. The density of the melt at each 45 model step was determined using the CIPW norm calculation [e.g., Hollocher, 2013], and 2 46 resulting melt densities are shown in Table S2. The density of each lithology with melt-filled 47 pore spaces can be calculated using the following variation of equation S2: ρgrain+melt−filled pores = ρgrain (1 − 𝑃) + ρmelt (𝑃) . 48 (S3) 49 Calculated densities for each lithology with melt-filled pore spaces are shown in Table S2. 50 Results for scenario 3a indicate that melt-filled pore spaces yield higher densities for the basalt 51 ultramafic layers (3.4–3.6 g cm-3) than for the gabbroic and noritic layers (3.2–3.4 g cm-3), 52 though densities do not change significantly throughout the solidified melt sheet for scenario 1a. 53 The main text further discusses implications of the differentiation sequence and modeled 54 lithologies. 55 56 References 57 Abramov, O., and D. A. Kring (2004), Numerical modeling of an impact-induced hydrothermal 58 system at the Sudbury crater, Journal of Geophysical Research, 109(E10007), 59 doi:10.1029/2003JE002213. 60 Huang, Q., and M. A. Wiezcorek (2012), Density and porosity of the lunar crust from gravity 61 and topography, Journal of Geophysical Research, 117(E05003), doi: 62 10.1029/2012JE004062. 63 64 65 Jeanloz, R., and T. J. Ahrens (1978), The equation of state of a lunar anorthosite: 60025, Proceedings of the Lunar Planetary Science Conference, 9, 2789-2803. W. S. Kiefer, R. J. Macke, D. T. Britt, A. J. Irving, and G. J. Consolmagno (2012a), The density 66 and porosity of lunar rocks, Geophysical Research Letters, 39(L07201), doi: 67 10.1029/2012GL051319. 3 68 W. S. Kiefer, R. J. Macke, D. T. Britt, A. J. Irving, and G. J. Consolmagno (2012b), Density and 69 porosity of lunar feldspatchic rocks and implications for lunar gravity modeling, 70 Conference of Lunar Highlands Crust, 2, abstract 9006. 71 Wieczorek, M. A., G. A. Neumann, F. Nimmo, W. S. Kiefer, G. J. Taylor, H. J. Melosh, R. J. 72 Phillips, S. C. Solomon, J. C. Andrews-Hanna, S. W. Asmar, A. S. Konopliv, F. G. 73 Lemoine, D. E. Smith, M. M. Watkins, J. G. Williams, and M. T. Zuber (2013), The crust 74 of the Moon as seen by GRAIL, Science, 339(6120), 671-675, doi: 75 10.1126/science.1231530. 4
