20 points - Streetsboro City Schools
advertisement
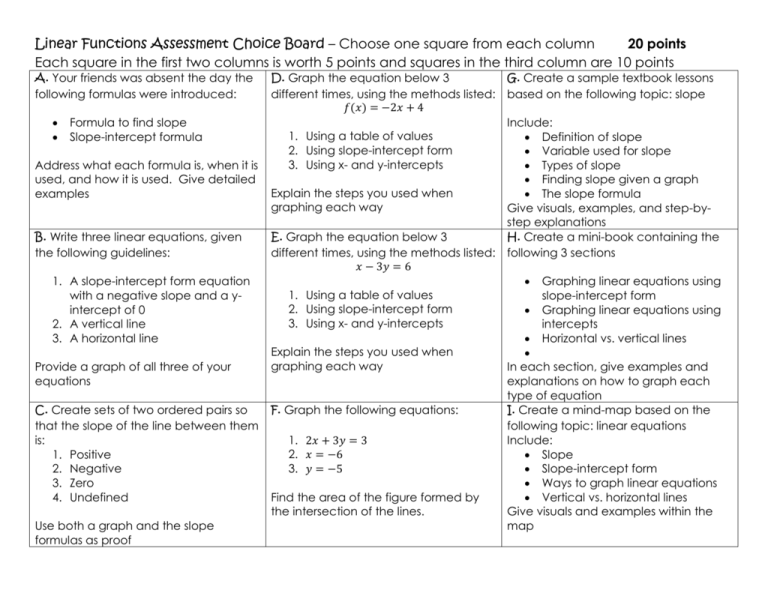
Linear Functions Assessment Choice Board – Choose one square from each column 20 points Each square in the first two columns is worth 5 points and squares in the third column are 10 points A. Your friends was absent the day the following formulas were introduced: Formula to find slope Slope-intercept formula Address what each formula is, when it is used, and how it is used. Give detailed examples B. Write three linear equations, given the following guidelines: 1. A slope-intercept form equation with a negative slope and a yintercept of 0 2. A vertical line 3. A horizontal line Provide a graph of all three of your equations C. Create sets of two ordered pairs so that the slope of the line between them is: 1. Positive 2. Negative 3. Zero 4. Undefined Use both a graph and the slope formulas as proof D. Graph the equation below 3 G. Create a sample textbook lessons different times, using the methods listed: based on the following topic: slope 𝑓(𝑥) = −2𝑥 + 4 Include: 1. Using a table of values Definition of slope 2. Using slope-intercept form Variable used for slope 3. Using x- and y-intercepts Types of slope Finding slope given a graph Explain the steps you used when The slope formula graphing each way Give visuals, examples, and step-bystep explanations E. Graph the equation below 3 H. Create a mini-book containing the different times, using the methods listed: following 3 sections 𝑥 − 3𝑦 = 6 Graphing linear equations using 1. Using a table of values slope-intercept form 2. Using slope-intercept form Graphing linear equations using 3. Using x- and y-intercepts intercepts Horizontal vs. vertical lines Explain the steps you used when graphing each way In each section, give examples and explanations on how to graph each type of equation F. Graph the following equations: I. Create a mind-map based on the following topic: linear equations 1. 2𝑥 + 3𝑦 = 3 Include: 2. 𝑥 = −6 Slope 3. 𝑦 = −5 Slope-intercept form Ways to graph linear equations Vertical vs. horizontal lines Find the area of the figure formed by the intersection of the lines. Give visuals and examples within the map

