Section 6abc review and key
advertisement
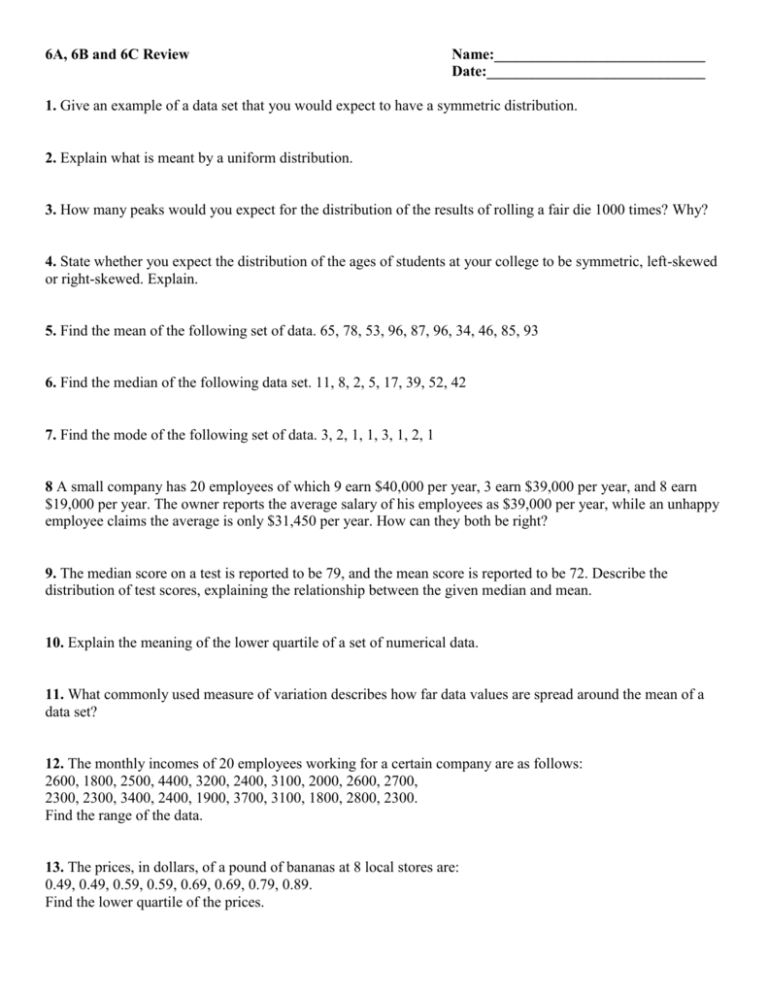
6A, 6B and 6C Review Name:____________________________ Date:_____________________________ 1. Give an example of a data set that you would expect to have a symmetric distribution. 2. Explain what is meant by a uniform distribution. 3. How many peaks would you expect for the distribution of the results of rolling a fair die 1000 times? Why? 4. State whether you expect the distribution of the ages of students at your college to be symmetric, left-skewed or right-skewed. Explain. 5. Find the mean of the following set of data. 65, 78, 53, 96, 87, 96, 34, 46, 85, 93 6. Find the median of the following data set. 11, 8, 2, 5, 17, 39, 52, 42 7. Find the mode of the following set of data. 3, 2, 1, 1, 3, 1, 2, 1 8 A small company has 20 employees of which 9 earn $40,000 per year, 3 earn $39,000 per year, and 8 earn $19,000 per year. The owner reports the average salary of his employees as $39,000 per year, while an unhappy employee claims the average is only $31,450 per year. How can they both be right? 9. The median score on a test is reported to be 79, and the mean score is reported to be 72. Describe the distribution of test scores, explaining the relationship between the given median and mean. 10. Explain the meaning of the lower quartile of a set of numerical data. 11. What commonly used measure of variation describes how far data values are spread around the mean of a data set? 12. The monthly incomes of 20 employees working for a certain company are as follows: 2600, 1800, 2500, 4400, 3200, 2400, 3100, 2000, 2600, 2700, 2300, 2300, 3400, 2400, 1900, 3700, 3100, 1800, 2800, 2300. Find the range of the data. 13. The prices, in dollars, of a pound of bananas at 8 local stores are: 0.49, 0.49, 0.59, 0.59, 0.69, 0.69, 0.79, 0.89. Find the lower quartile of the prices. 14. A set of data consists of the numbers: 4.3, 5.2, 5.4, 5.5, 5.7, 6.1, 6.1, 7.3, 7.5, 8.2. Find the five-number summary for the data. 15. The heights, in inches, of fourteen students are: 42, 44, 44, 45, 46, 47, 48, 49, 50, 51, 54, 56, 58, 60. Make a box plot for the data. 16. The heights, in inches, of a group of two year old boys are: 35, 35.5, 32, 32.5, 38, 37, 37, 36. Calculate the standard deviation. 17. The prices, in dollars, of a gallon of regular gasoline at 5 gas stations at the same freeway exit are: 2.41, 2.43, 2.43, 2.47, 2.51. Estimate the standard deviation of the prices using the range rule of thumb. Where appropriate, you may use the following table of z-scores and percentiles. 18. Bob took a standardized test, and his score was in the 79th percentile. Explain the meaning of this statement. 19. Assume that a set of test scores is normally distributed with a mean of 78 and a standard deviation of 10. What percentage of scores lie between 78 and 98? 20. Assume that a set of test scores is normally distributed with a mean of 820 and a standard deviation of 35. In what percentile is a score of 750? 21. Suppose a data set has a mean of 126 and a standard deviation of 4. Find the z-score for a data value of 133. 22. What is the z-score of a data value that is 0.4 standard deviations above the mean? In what percentile is that data value? 23. About how many standard deviations above or below the mean is a data value in the 21st percentile? 24. Suppose that, in a company with 775 employees, the monthly salaries are normally distributed. The mean salary is $4600, with a standard deviation of $800. About how many of the employees earn more than $4200 per month? 25. Prior to re centering in 1995, the mean SAT verbal score was about 430. Assume that the standard deviation was 100 points. Find the z-score and the percentile for a student who scored 580. 26. After re centering in 1995, the mean SAT math score was about 500. Assume that the standard deviation was 100 points. Find the z-score and the percentile for a student who scored 520. 27. The average person has an IQ of 100, and scores are normally distributed with a standard deviation of 15 points. What percentage of people have an IQ between 100 and 130? 6A, 6B and 6C Review-KEY 1. Possible answer: SAT scores. 2. A uniform distribution has no peaks. 3. Since the six possible outcomes are equally likely, we expect the distribution to be uniform with no peak. 4. The distribution would be right-skewed. Most students would be between 18 and 22 years old, but the age of the few older students would pull the mean to the right. 5. 73.3 6. 14 7. 1 8. The owner is using the median salary as the average, while the employee is using the mean salary as the average. 9. Since the mean score is less than the median score, the distribution is likely to be left-skewed. There may also be outliers, such as a score of 0, that would drastically reduce the mean score but have little effect on the median score. 10. Possible answer: One quarter of the data lie at or below the lower quartile. 11. standard deviation 12. 2600 13. $0.54 14. low = 4.3, lower quartile = 5.4, median = 5.9, upper quartile = 7.3, high = 8.2 15. 60 54 48.5 45 42 16. 2.2 pounds 17. $0.025 18. 79% of the students who took the test received scores lower than Bob’s score. 19. 47.72% 20. 2.5th percentile (actually 2.28th percentile) 21. 1.75 22. .4; 65th percentile 23. 0.8 standard deviation below 24. 535 employees 25. 1.5; 93rd percentile 26. 0.2; 57th percentile 27. 47.72%
